USD/CAD Price Analysis: Retreats from previous support around 1.2600
- USD/CAD fades bounce off six-week low, holds lower ground near intraday bottom.
- Bearish MACD signals, downbeat RSI and weekly resistance line keep buyers away.
- 200-DMA, 61.8% Fibonacci retracement level offer strong resistance.
USD/CAD remains on the back foot at around 1.2580, reversing the previous day’s bounce off a 1.5-month low, heading into Monday’s European session.
In doing so, the Loonie pair takes a U-turn from the support-turned-resistance line from early April, around 1.2600 by the press time. Also keeping the USD/CAD bears hopeful are the bearish MACD signals and downbeat RSI.
That said, the 78.6% Fibonacci retracement of the April-May downside, near 1.2545 lures short-term USD/CAD sellers.
However, RSI (14) is speedily approaching oversold territory, which in turn suggests a limited downside to watch.
This highlights the late April swing low near 1.2460 as an intermediate halt before directing USD/CAD bears towards the April month’s bottom surrounding .2400.
On the contrary, a clear upside break of the previous support line near 1.2600 isn’t a welcome to the USD/CAD buyers as a downward sloping resistance line from May 25, near 1.2620, will act as an extra filter to the north.
It’s worth noting that the pair bulls remain cautious until witnessing a daily closing beyond the 1.2660 resistance confluence, including the 200-DMA and 61.8% Fibonacci retracement.
USD/CAD: Daily chart
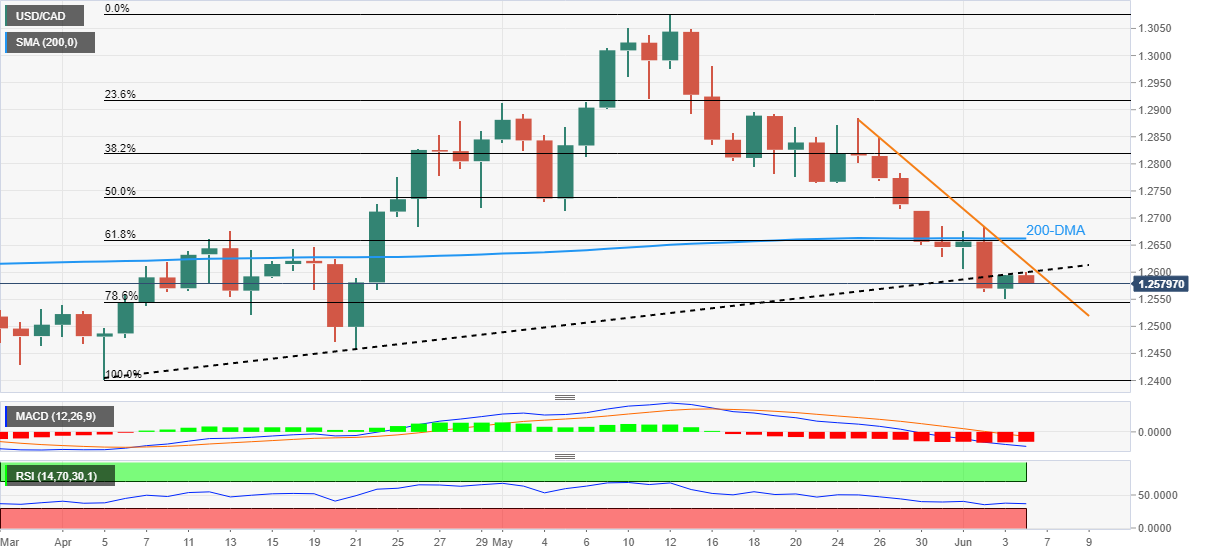
Trend: Bearish