Gold Price Forecast: XAU/USD key levels to watch, Fed in focus – Confluence Detector
- Gold price remains stuck between the Russia-Ukraine crisis and the Fed.
- Traders turn cautious as Fed is likely to hint at a March rate hike.
- Gold Price Forecast: XAU/USD risks correction on death cross, potential Fed’s hawkishness
Gold price has paused its two-day uptrend, as bulls contemplate the next move, in anticipation of the critical Fed interest rate decision. Fed is seen hinting at a March rate lift-off while traders will closely eye any signals on the timing of the balance sheet reduction. Expectations of a hawkish Fed outcome are limiting the upside in gold price, although bulls draw support from the ongoing Russia-Ukraine geopolitical turmoil. Let’s take a look at gold’s key technical levels in the run-up to the Fed showdown.
Read: Fed January Preview: Three possible scenarios for gold
Gold Price: Key levels to watch
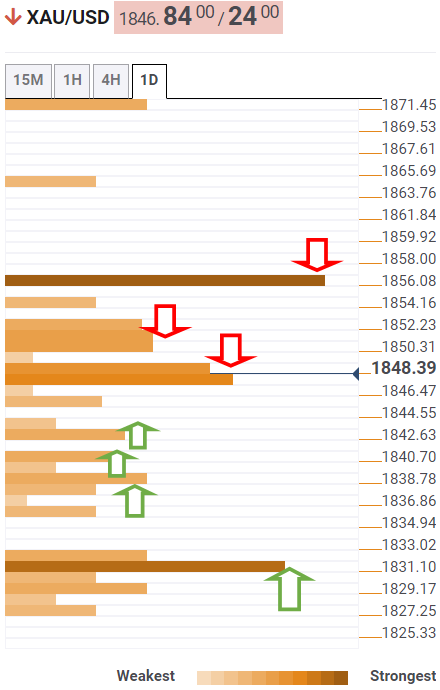
The Technical Confluences Detector shows that the gold price is consolidating below a bunch of healthy resistance levels stacked up around $1,849.
At that supply zone, the previous week’s high coincides with Fibonacci 38.2% one-day.
The immediate upside meets strong offers around $1,852, the confluence of the pivot point one-week R1, Fibonacci 23.6% one-day and Bollinger Band one-day Upper.
The intersection of the pivot point one-day R1 and pivot point one-month R1 at $1,856 is the level to beat for gold bulls.
On the other hand, if the correction picks up steam, then the immediate support awaits at the Fibonacci 61.8% one-day at $1,842.
The next significant cushion is placed at $1,840, the SMA5 one-day, below which the Fibonacci 23.6% one-week at $1,837 will get tested.
A sharp sell-off will be triggered below the last, calling for a test of the previous month’s high of $1,831.
Here is how it looks on the tool
About Technical Confluences Detector
The TCD (Technical Confluences Detector) is a tool to locate and point out those price levels where there is a congestion of indicators, moving averages, Fibonacci levels, Pivot Points, etc. If you are a short-term trader, you will find entry points for counter-trend strategies and hunt a few points at a time. If you are a medium-to-long-term trader, this tool will allow you to know in advance the price levels where a medium-to-long-term trend may stop and rest, where to unwind positions, or where to increase your position size.