USD/JPY Price Analysis: Stays indecisive below 114.00 inside weekly descending triangle
- USD/JPY pares early Asian session losses but stays neutral on a day.
- Bullish chart pattern keeps buyers hopeful amid upbeat MACD, RSI.
- Sellers have a bumpy road before testing 113.00, December’s low.
USD/JPY licks its wounds near 113.90 amid the pre-Fed inactive Asian session on Wednesday.
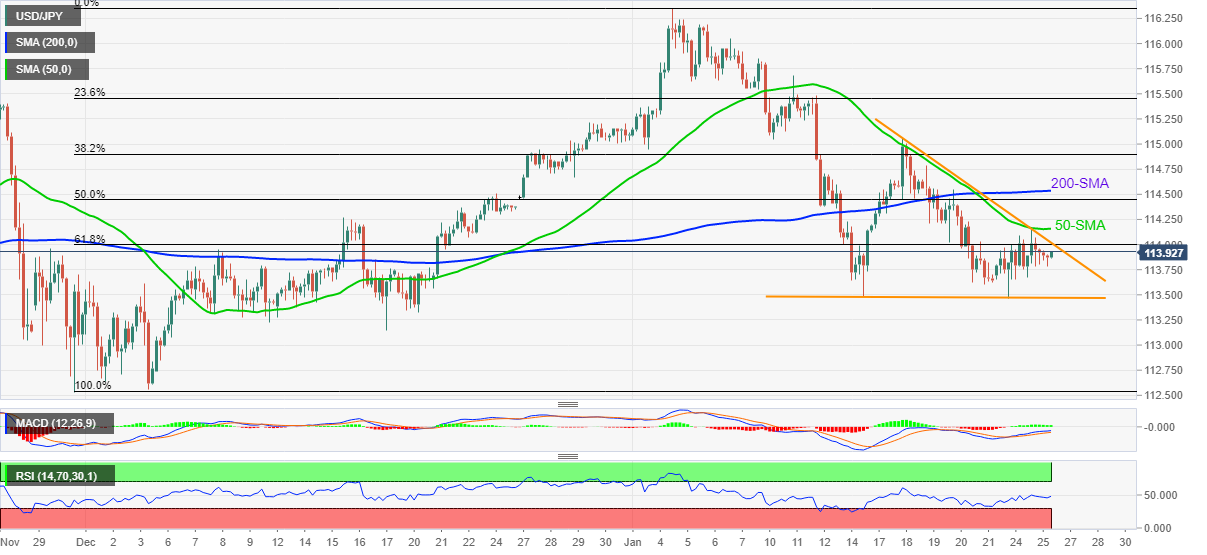
In doing so, the yen pair stays inside a short-term bullish chart pattern, namely ascending triangle, amid firmer MACD and RSI signals.
However, a convergence of the 61.8% Fibonacci retracement (Fibo.) of November-January upside and the upper line of the stated triangle from January 14, challenge the pair’s immediate upside moves near 114.00.
Also acting as important resistances are the 50-SMA and 200-SMA levels surrounding 114.15 and 114.55 in that orders.
Should USD/JPY rises past 114.55, its run-up towards the monthly high of 116.35 can be expected.
Meanwhile, the lower line of the triangle close to 113.45 limits the quote’s nearby declines, a break of which will direct USD/JPY sellers towards multiple supports marked since early December near 113.20.
Following that, the 113.00 threshold and the previous month’s low of 112.53 will be in focus.
USD/JPY: Four-hour chart
Trend: Recovery expected