EUR/USD Price Analysis: Seesaws inside monthly falling wedge below 1.1800
- EUR/USD keeps bounce off 12-day-old support line despite stepping back from 100-SMA.
- Bullish chart pattern, upbeat Momentum back the buyers.
- Bears have multiple hurdles to conquer before the yearly low.
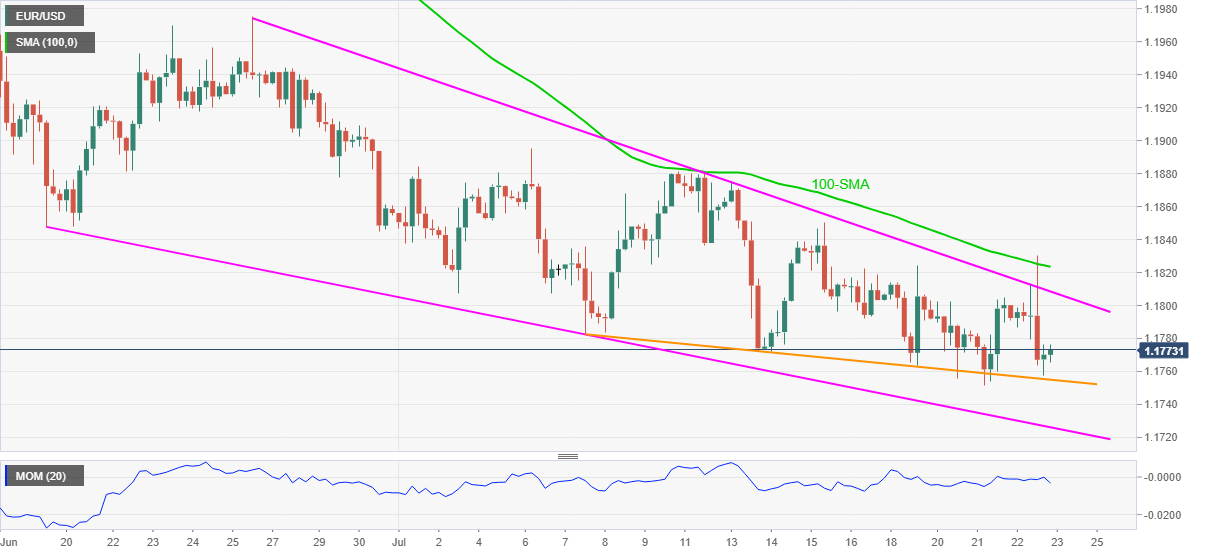
EUR/USD picks up bids to 1.1775, consolidating the pullback from 100-SMA, during Friday’s Asian session. In doing so, the major currency pair bounces off a short-term support line inside a one-month-old falling wedge bullish chart pattern on the four-hour (4H) play.
Given the firmer Momentum line and the pair’s repeated failures to break immediate support, EUR/USD is likely o mark another battle with the 100-SMA level of 1.1825.
During the rise, the 1.1800 threshold and an upper line of a falling wedge, near 1.1810, will act as intermediate halts.
However, a clear upside break of 1.1825 will act as a trend reversal signal and could recall the 1.2000 psychological magnet back to the chart.
On the flip side, the nearby support line and the wedge’s lower line, respectively around 1.1755 and 1.1725, will restrict the short-term EUR/USD downturn ahead of the yearly low near the 1.1700 round figures.
It’s worth noting that the pair’s sustained weakness past 1.1700 will not hesitate to direct the bears toward the late 2020 lows near 1.1600.
EUR/USD: Four-hour chart
Trend: Recovery expected