Dollar Index Price Analysis: DXY eyes minor pullback after four-day winning run
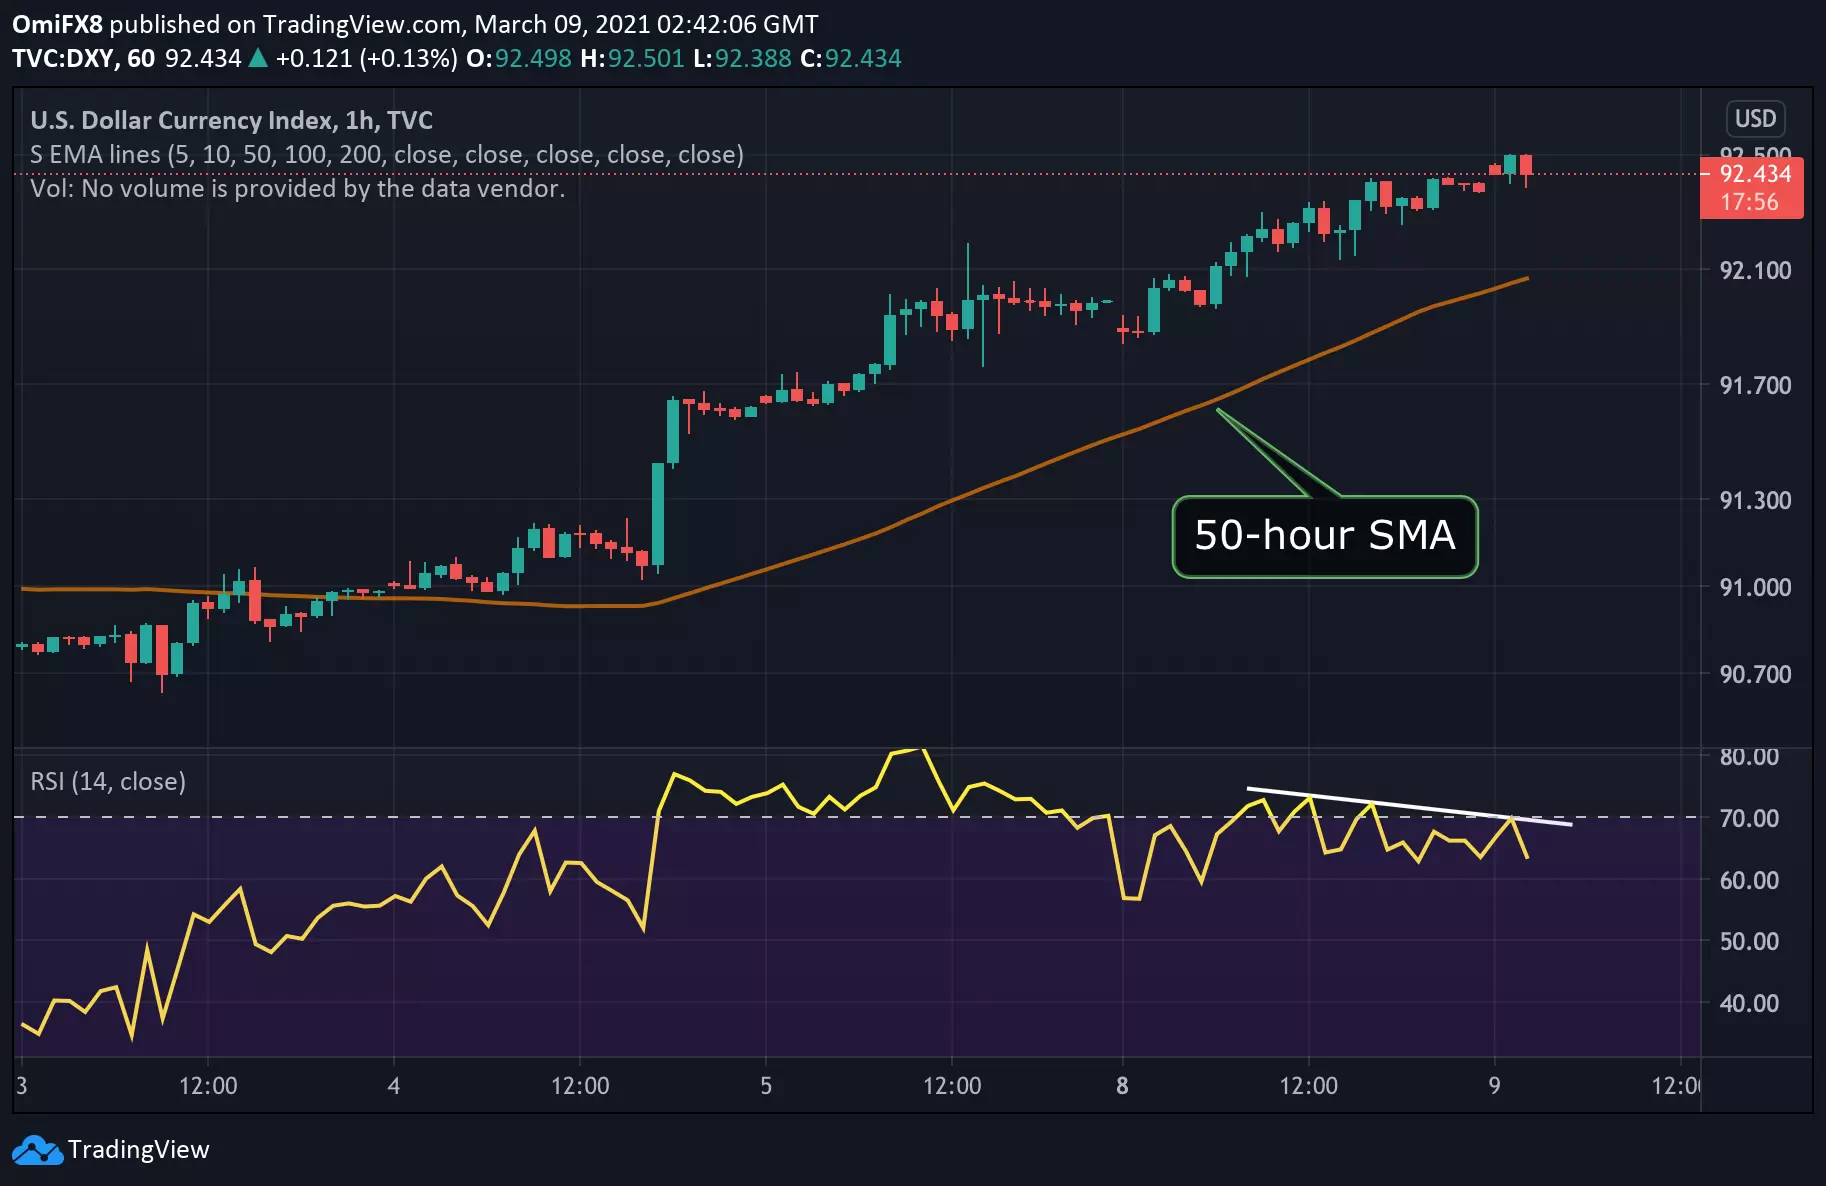
- The DXY's hourly chart shows a bearish RSI pattern.
- A minor drop to the 50-hour SMA support may be seen.
The dollar index (DXY), which tracks the greenback's value against majors, has retreated from the session high of 92.50 to 92.40.
The pullback may be extended further as the hourly chart Relative Strength Index (RSI) shows a bearish divergence. It occurs when an indicator charts lower highs contradicting higher highs on the price chart and often paves the way for pullbacks.
The DXY may test the 50-hour Simple Moving Average support, currently at 92.07.
The broader outlook would remain bullish while the former hurdle-turned-support of 91.60 (Feb. 5 high) is intact. The DXY rose for the fourth straight trading day on Monday as the Treasury yields remained elevated, helping the greenback draw bids in the wake of the US Senate's decision to approve President Joe Biden's $1.9 trillion stimulus program.
Daily chart
Trend: Minor pullback likely
Technical levels