USD/CAD Price Analysis: Keeps pullback from five-week-old resistance line above 1.2700
- USD/CAD snaps two-day winning streak while easing from one-week top.
- Strong RSI, sustained trading beyond 21-day EMA favor bulls.
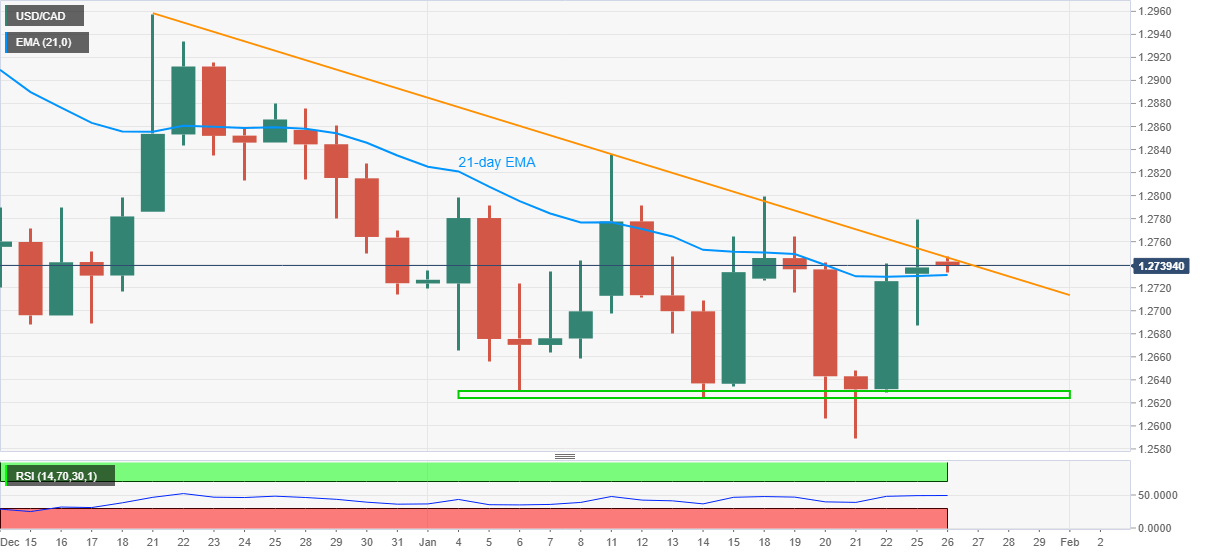
USD/CAD consolidates recent gains around 1.2740 during the initial Asian trading on Tuesday. The loonie pair jumped to the highest since January 18 the previous day while piercing a downward sloping trend line from December 21. However, failures to provide a daily closing beyond the stated resistance line test the buyers cheering a successful break of 21-day EMA.
With the RSI conditions being far from overbought, the USD/CAD upside momentum can’t be ruled out unless the quote stays above short-term EMA support. Though, a clear break of the immediate trend line resistance becomes necessary for the bull’s re-entry.
While an upside clearance of 1.2750, comprising the stated resistance line, can easily challenge the last week’s top surrounding 1.2800, further advances may be questioned by the monthly high near $1.2835.
On the contrary, a downside break of 21-day EMA, at 1.2731 now, will have 1.2700 and 1.2660-55 as following levels to please short-term USD/CAD sellers.
Though, a horizontal area including multiple lows marked since January 06, around 1.2630/25, will restrict the quote’s declines below 1.2655.
USD/CAD daily chart
Trend: Bullish