GBP/USD Price Analysis: Extends recovery from 50-bar EMA to pierce 1.3350
- GBP/USD fails to stretch Wednesday’s losses while keeping bounces off 1.3283.
- A one-week-old support line regains its important, suggests further upside.
- August 19 tops, key Fibonacci retracements add to the support.
GBP/USD remains on the front-foot around 1.3353 amid the initial Asian session on Thursday. The cable snapped a three-day winning streak the previous day but break 50-bar EMA support. The following pullback puts the quote back above an ascending trend line from August 25, which in turn favors the further upside as RSI conditions are also normal.
As a result, 1.3400 becomes the immediate level to watch during the pair’s further upside ahead of the yearly high near 1.3485.
However, the bulls will have to cross the previous year’s peak surrounding 1.3515 to justify their additional strength towards targeting a move beyond 1.3600 round-figures.
Alternatively, multiple highs marked on August 19 around 1.3265 act as additional support below the immediate trend line and 50-bar EMA, respectively near 1.3340 and 1.3280.
Furthermore, 50% and 60% Fibonacci retracement level of the pair’s run-up from August 04, close to 1.3230 and 1.3170 in that order, offer extra filters to the downside.
GBP/USD four hour chart
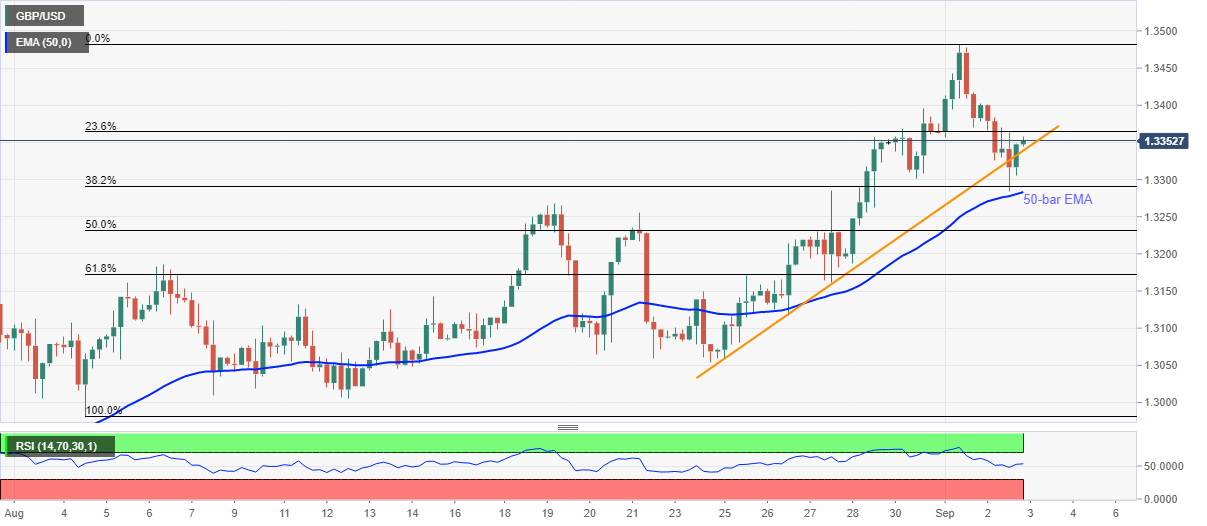
Trend: Bullish