USD/JPY Price Analysis: There has been a significant trendline break on the hourly chart
- USD/JPY is trading 0.43% higher after some recent greenback strength.
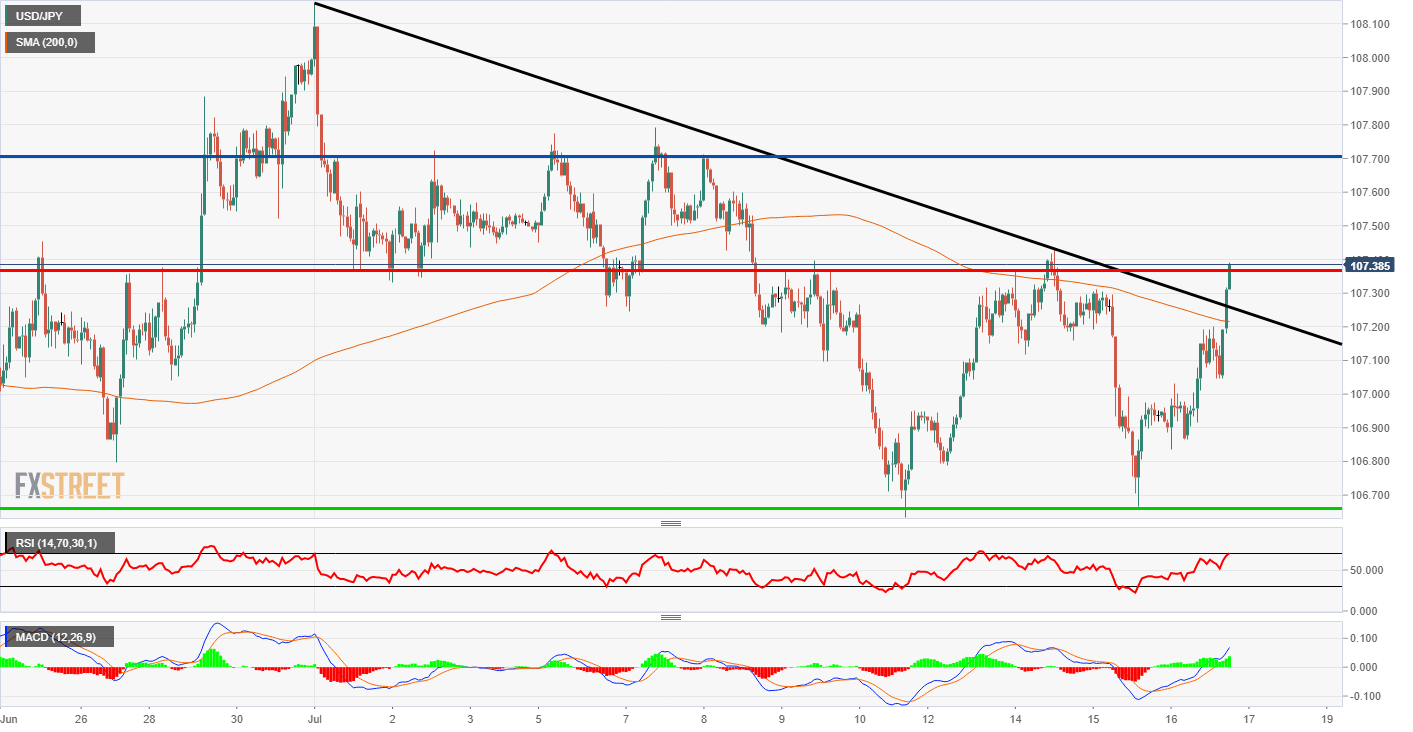
- There is a prominent trendline on the hourly chart that has been broken to the upside.
USD/JPY 1-hour chart
USD/JPY has been pushing higher during the US session on Thursday after some recent strength in the dollar. There has been some weakness in stocks on the session but it seems like there has been a flight into the dollar as some negative headlines hit the newswires. There have been some increased tensions between US and China and also rumours that Texas (unconfirmed) will announce a lockdown tomorrow.
Looking closer at the chart below the key feature is the trendline break. This lead to a move higher but there is a resistance zone right at the current price level. Beyond this, the next resistance level on the upside is the blue horizontal line at 107.70. Interestingly, as the price broke the trendline it also pushed past the 200 Simple Moving Average with ease.
Looking at the indicators, understandably they are both pointing to the upside. The MACD histogram and signal lines are above the zero point. The Relative Strength Index is in the positive overbought area which could mean there is a small pullback before the move continues.
On the daily timeframe, the pair has been in a sideways range and this move high will do nothing to change that at the moment but he aforementioned 107.70 looks like a magnet for the price even on that timeframe.
Additional level