WTI Price Analysis: Sluggish above $25.00 amid bullish MACD
- WTI seesaws within a small range around 23.6% Fibonacci retracement.
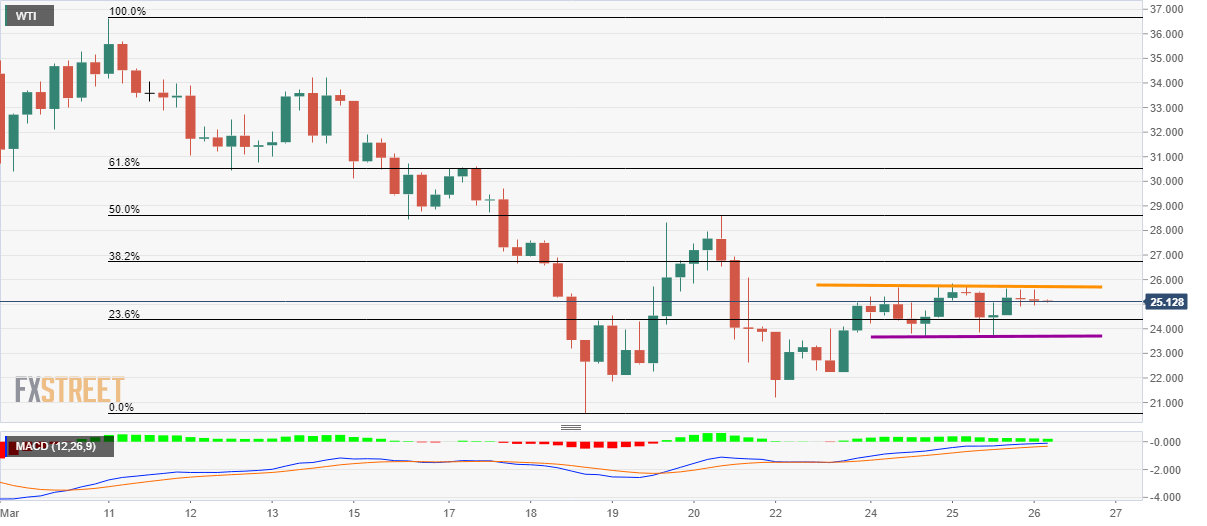
- $21.92/87 can add to the support whereas 50% of Fibonacci retracement may act as extra resistance.
While keeping nearly $2 choppy range momentum, WTI seesaws around $25.10, up 0.08%, during the pre-Europe session on Thursday.
The black gold currently drops towards the 23.6% Fibonacci retracement of March 11-18 fall, near $24.37, a break of which will highlight the range-support near $23.70.
In a case where the bears manage to conquer $23.70, $21.92/87 can offer a filter during the declines targeting the recent low near $20.57.
On the upside, sustained trading past-$25.85 could escalate the recovery moves towards 50% Fibonacci retracement level near $28.60 and 61.8% Fibonacci retracement around $30.50/55.
It should also be noted that the prices are near multi-year lows and the MACD is flashing bullish signals, which in turn could help extend the pullback moves.
WTI four-hour chart
Trend: Sideways