Back


10 Oct 2019
US Dollar Index technical analysis: DXY is on life support holding at one-week low near 98.63
- DXY has been hammered down to one-week low.
- The market is holding at a key support level at the 98.63 price level.
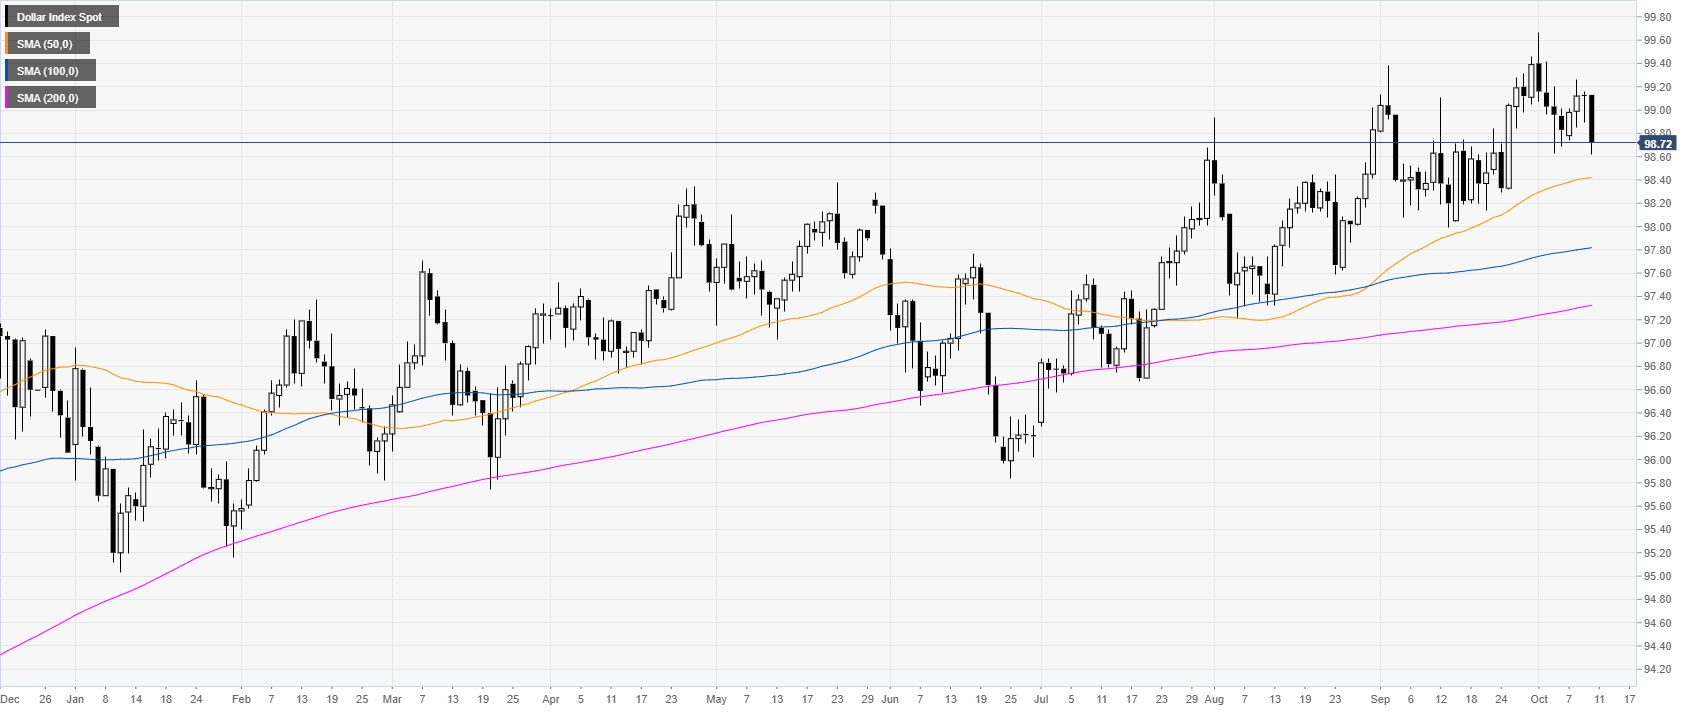
DXY daily chart
The US Dollar Index (DXY) is in a bull trend above the main daily simple moving averages (DSMAs). DXY fell as the European Central Bank Minutes showed opposition to QE (Quantitative Easing). In the New York session, the US Core Consumer Price Index (CPI) matched analysts’ expectations at 2.4% YoY.

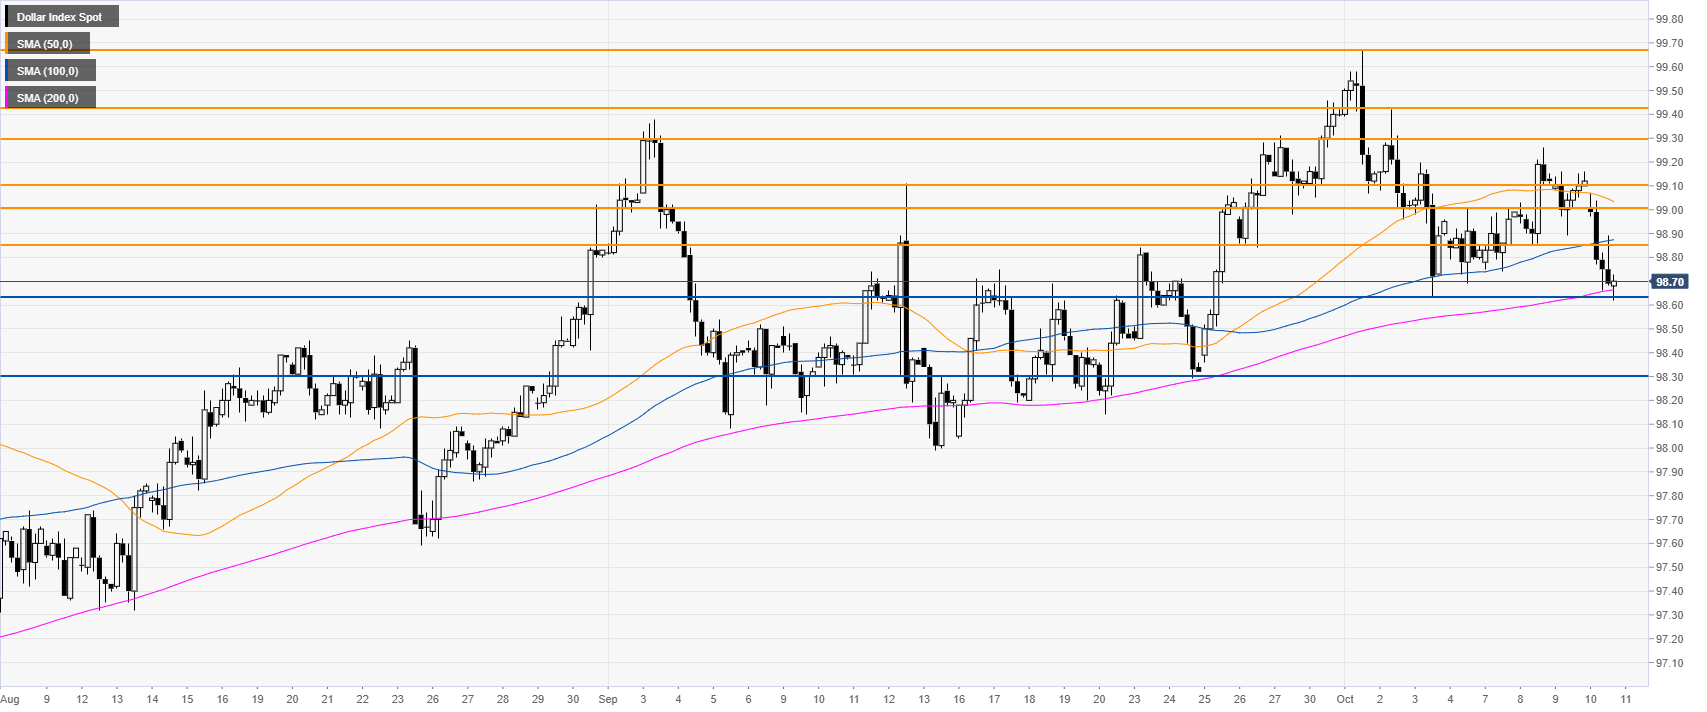
DXY four-hour chart
DXY is holding on at 98.63 key support near the 200 SMA on the four-hour chart. If the market can hold above this level DXY is set to continue its uptrend potentially revisiting the 99.00/99.10 zone. On the flips side, if the market loses the 96.63 level, then 98.30 can be on the cards for bears.

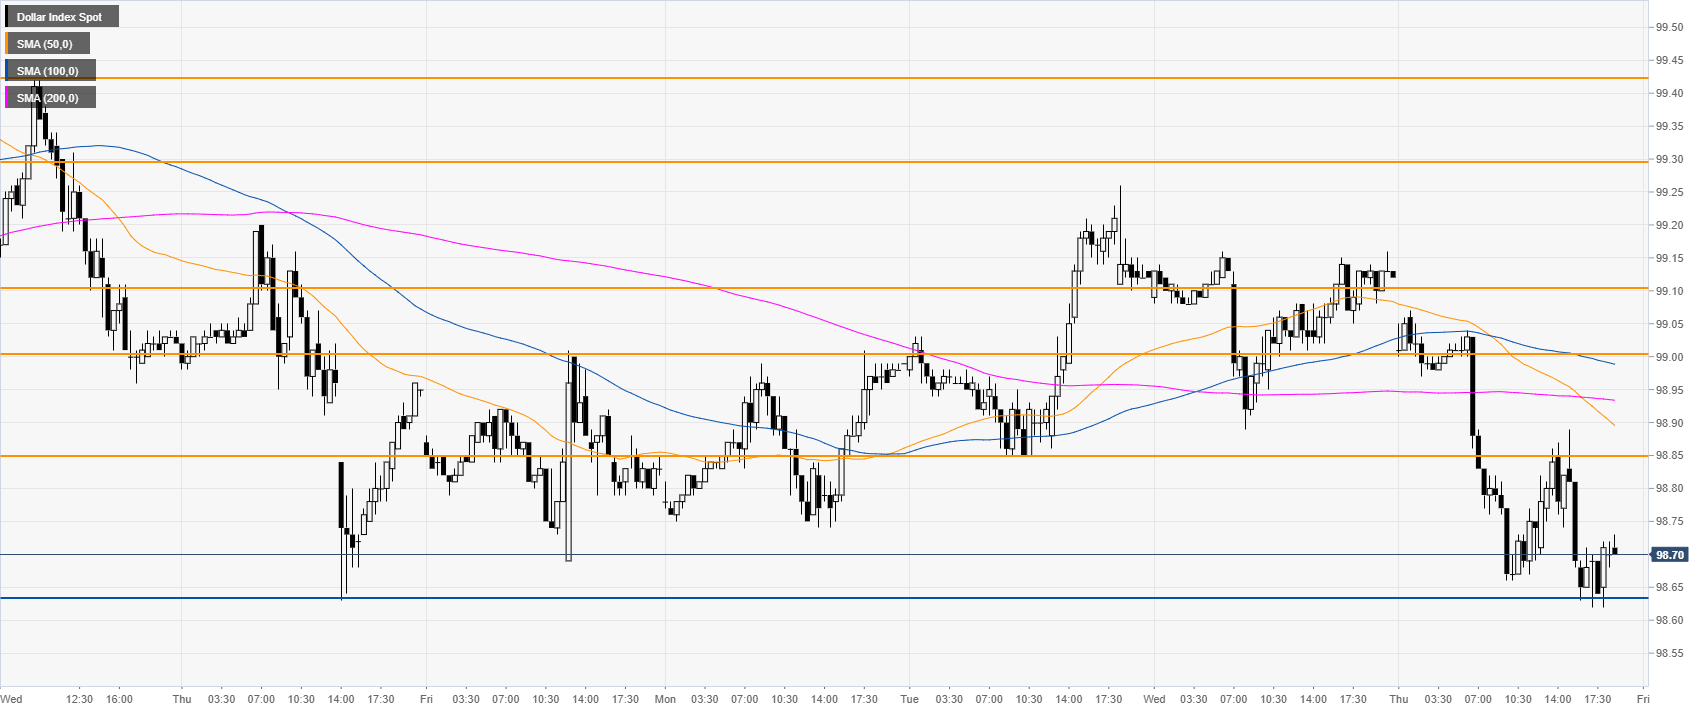
DXY 30-minute chart
DXY is trading below its main SMAs, suggesting a bearish momentum in the near term. Resistances are seen at the 98.85 and 99.00 price levels.

Additional key levels
