Back
8 Oct 2019
EUR/USD technical analysis: Euro rolling into the Asian session below the 1.0965 price level
- This Tuesday, EUR/USD slumped to three-day lows on USD strength.
- The level to beat for sellers is the 1.0940 support, followed by the 1.0910 level.
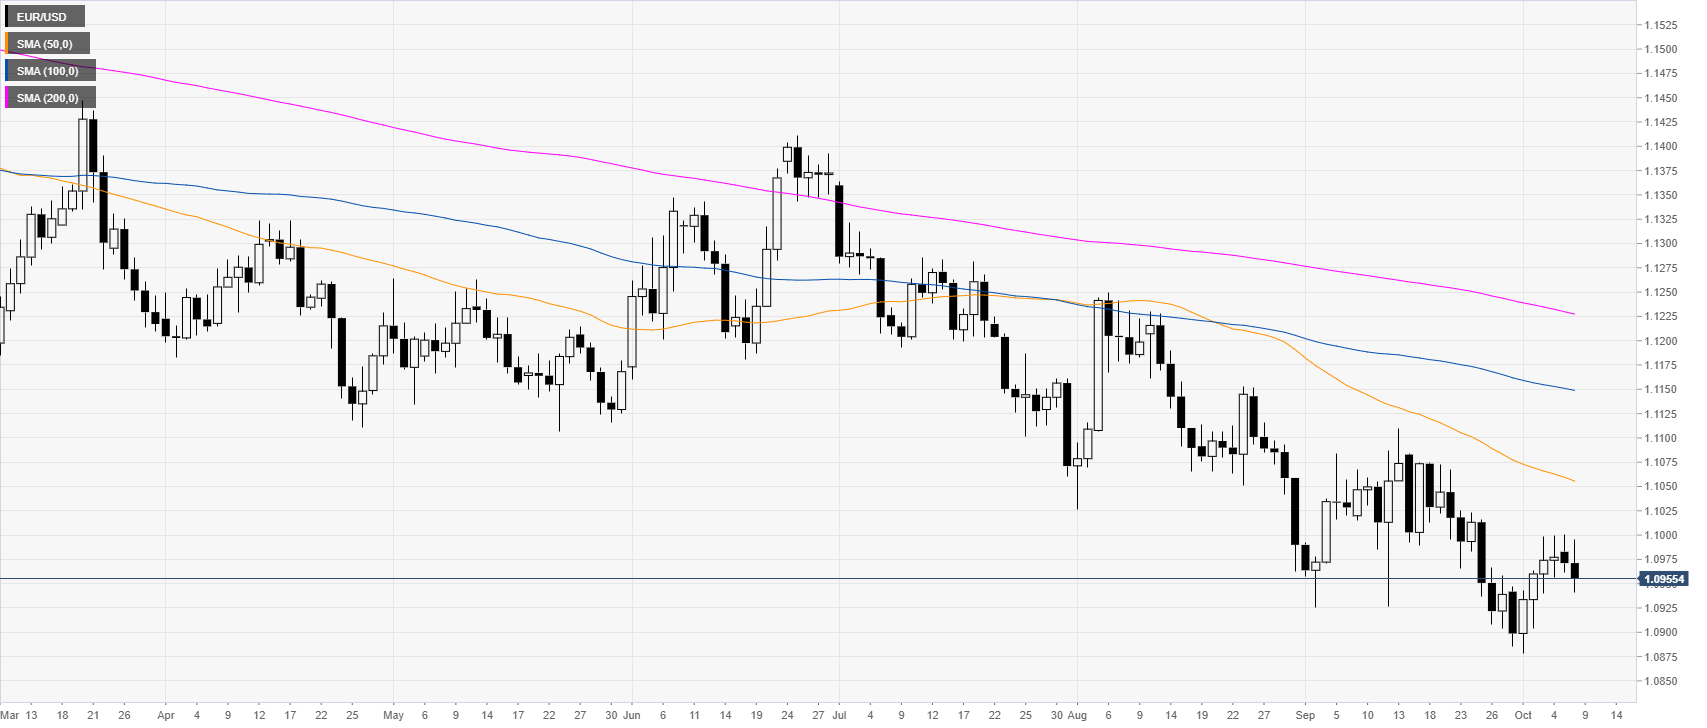
EUR/USD daily chart
On the daily chart, the shared currency is trading in a bear trend below the main daily simple moving averages (DSMAs). The Greenback has picked up some momentum this Tuesday despite the risk-off sentiment.
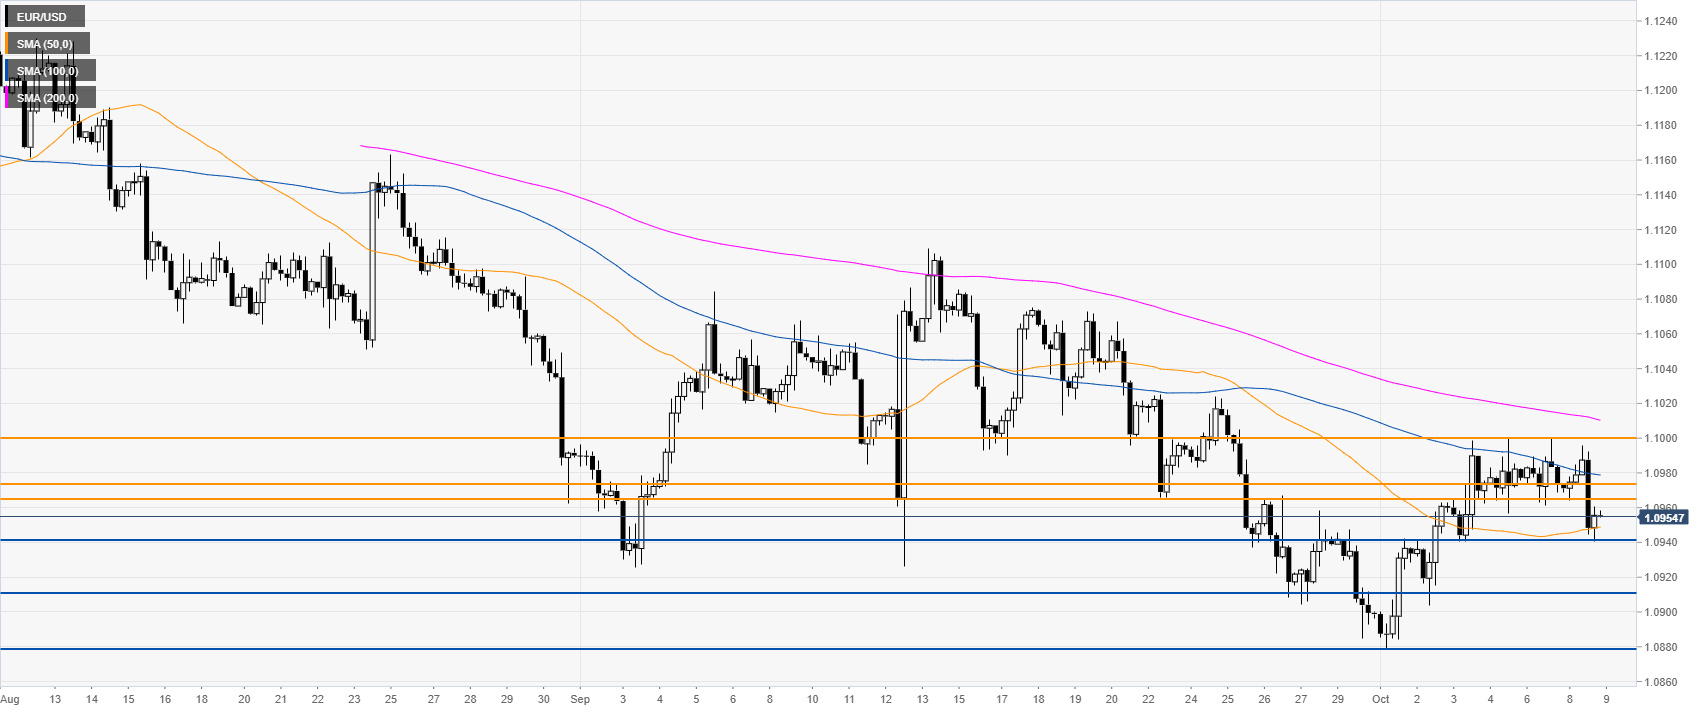
EUR/USD four-hour chart
After failing to break above the 1.1000 handle, EUR/USD broke below the 1.0960 support level. The market is consolidating the decline just above the 50 SMA on the four-hour chart. A break below 1.0940 could lead to the 1.0910 support level, according to the Technical Confluences Indicator.
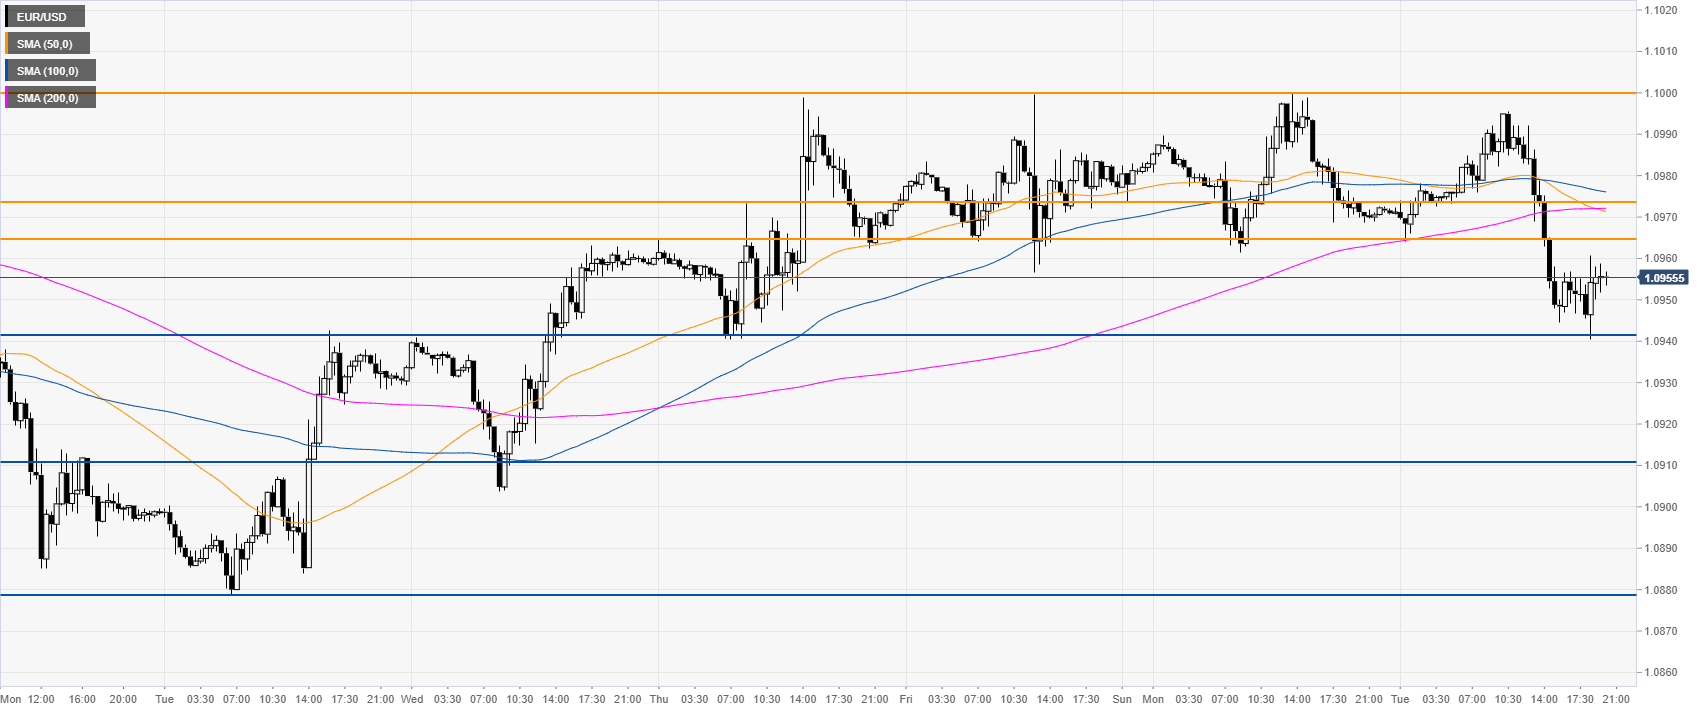
EUR/USD 30-minute chart
EUR/USD is trading below its main SMAs, suggesting a bearish bias in the near term. The first hurdle is seen at the 1.0965/77 resistance zone, followed by the 1.1000 handle, according to the Technical Confluences Indicator.
Additional key levels