Back
28 Aug 2019
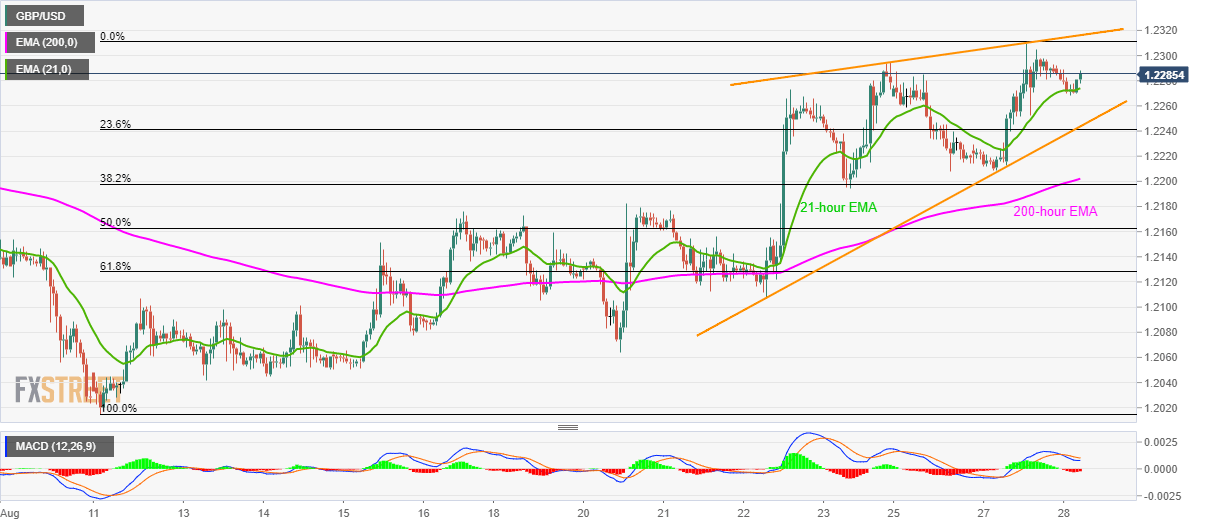
GBP/USD technical analysis: Bounces off 21-hour EMA
- 21-hour exponential moving average (EMA) questions the GBP/USD pair’s latest pullback.
- A downside break of 1.2244/41 will confirm short-term rising wedge bearish formation.
Following its U-turn from 21-hour EMA, GBP/USD takes the bids to 1.2285 while heading into Wednesday’s UK session opening.
Prices are now heading towards 1.2300 round figure prior to targeting monthly top of 1.2310. It should, however, be noted that pair’s rise beyond 1.2310 will be challenged by a three-day-old rising trend-line, close to 1.2320.
Meanwhile, pair’s declines below 21-hour EMA level near 1.2270 can fetch the quote to 1.2244/41 confluence including rising wedge’s support and 23.6% Fibonacci retracement of pair’s run-up since August 11.
If at all sellers sneak in around 1.2240, 200-hour EMA level of 1.2200 and August 20 high near 1.2105 will become their favorites.
GBP/USD hourly chart
Trend: Bullish