Back
9 Jul 2019
USD/CHF technical analysis: Greenback challenging the daily lows near 0.9930 against the Swiss franc
- USD/CHF is having a small correction down below 0.9933 resistance.
- Immediate support is at 0.9896 and 0.9875.
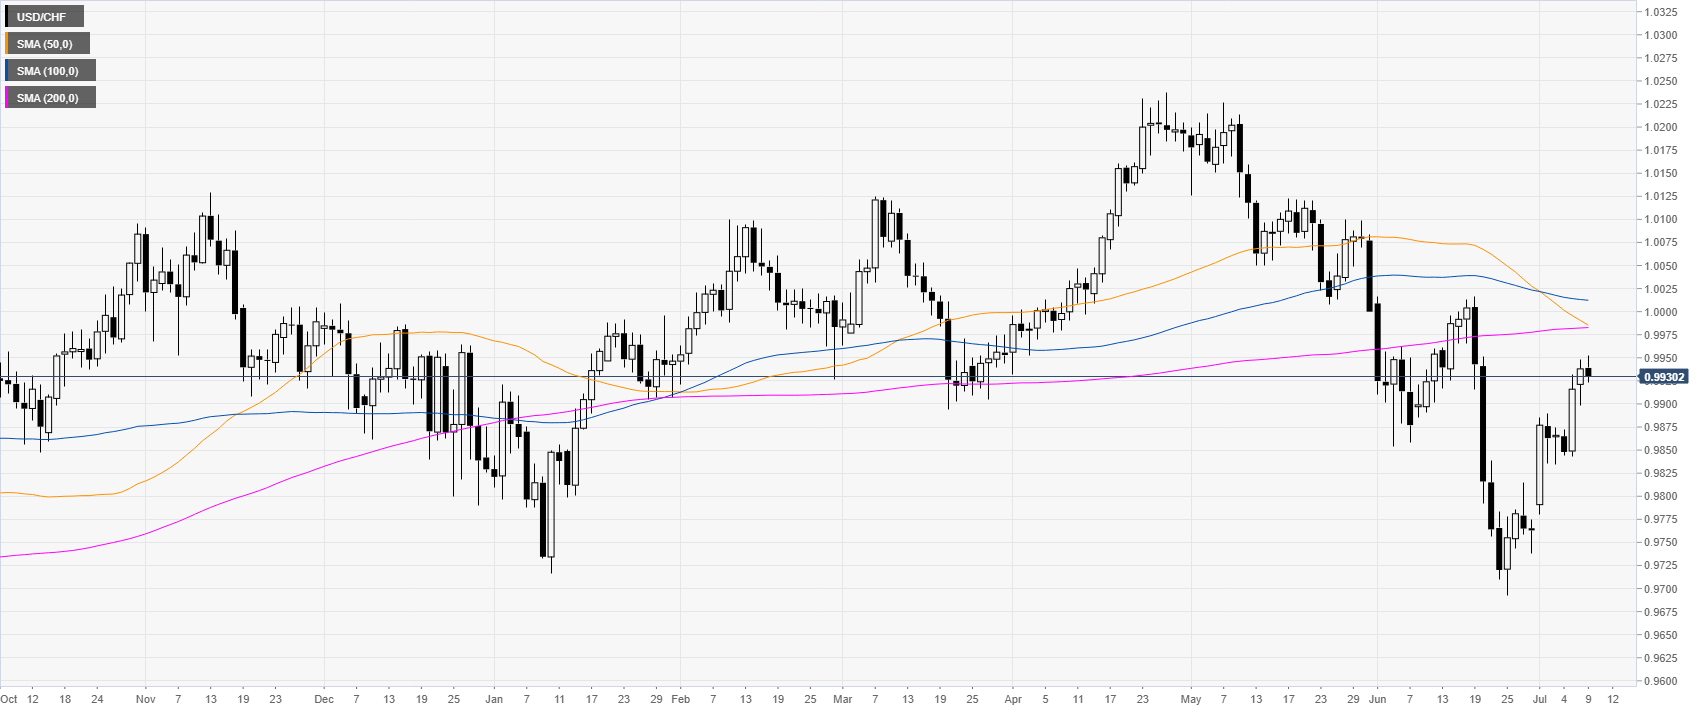
USD/CHF daily chart
USD/CHF is trading in a bull leg below its main daily simple moving average (DSMA).
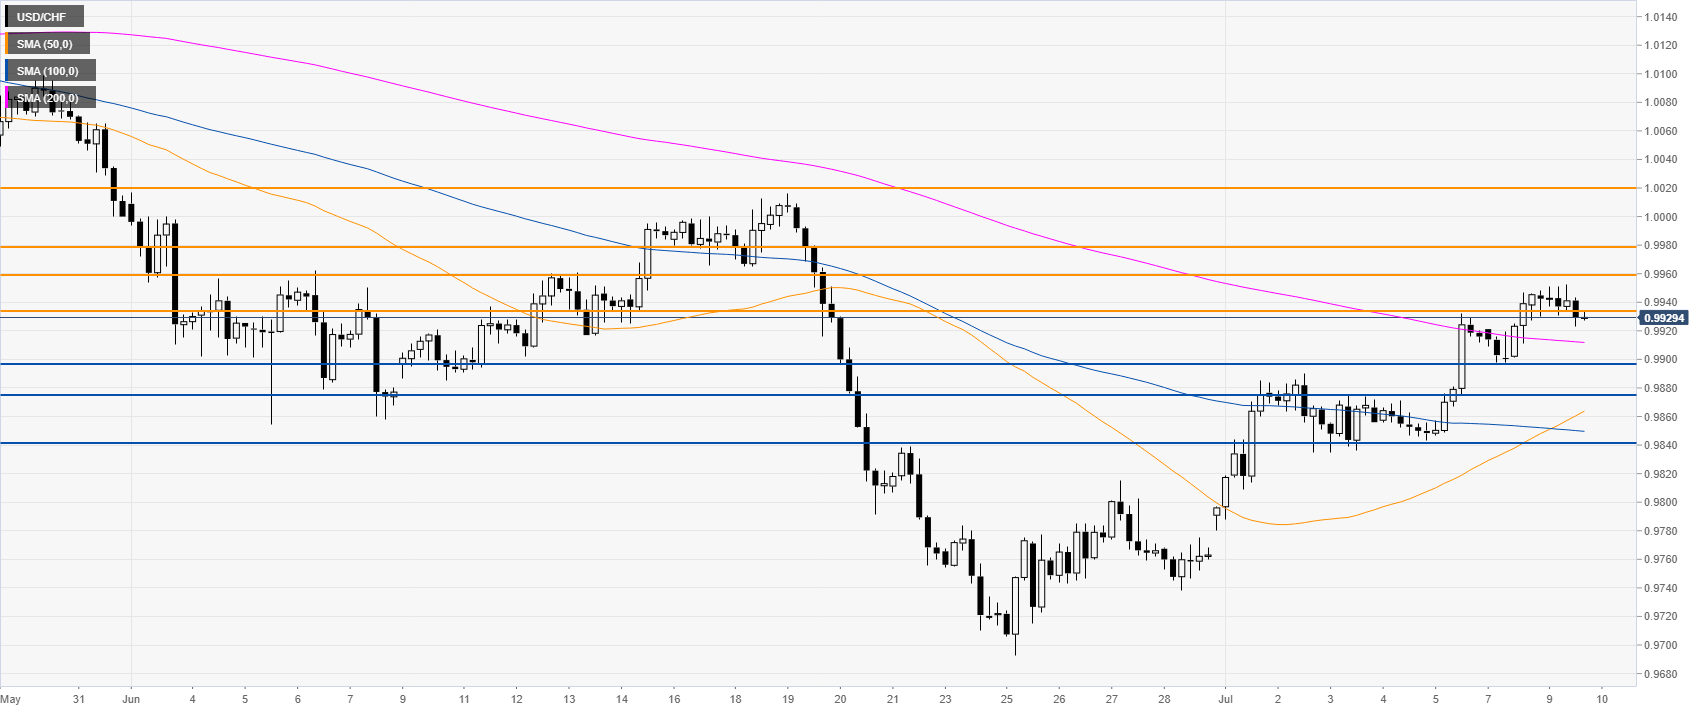
USD/CHF 4-hour chart
USD/CHF is trading above its main SMAs suggesting bullish momentum. The 50 SMA crossed above the 100 SMA which can be considered a bullish sign. Bulls will need to overcome 0.9958 resistance to reach 0.9978 and 1.0020 on the way up.
USD/CHF 30-minute chart
The market is trading below the 0.9933 resistance and the 50 SMA, suggesting that the market is consolidating. If the market continues to correct down, the next level of support is seen at 0.9896 and then at 0.9875 and the 0.9840 level, according to the Technical Confluences Indicator.

Additional key levels