Back
21 Mar 2019
USD/CAD Technical Analysis: US Dollar comes back above 1.3300 figure against CAD
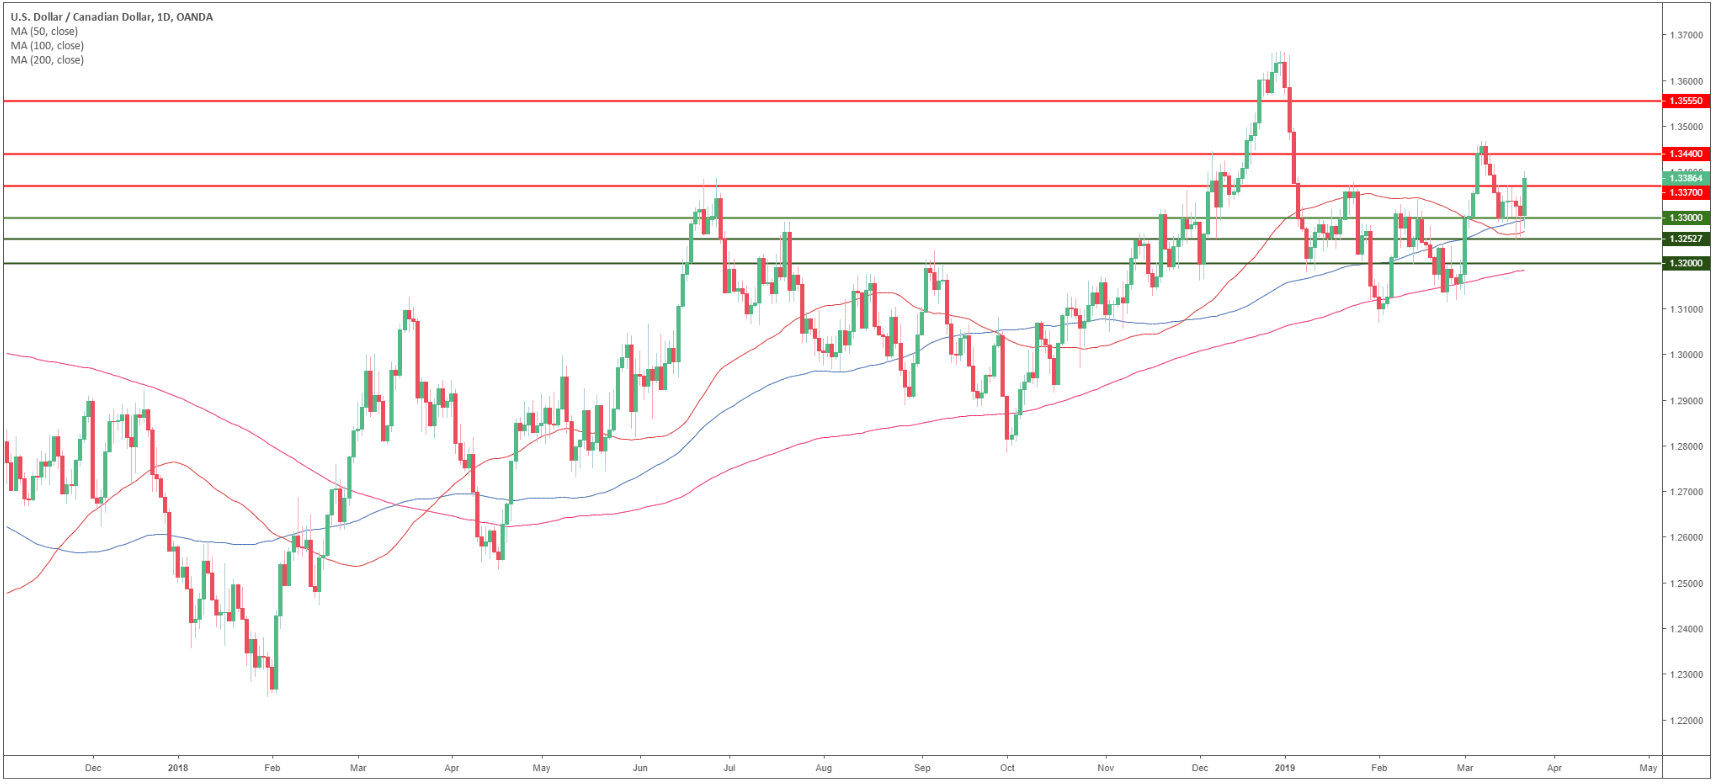
USD/CAD daily chart
- USD/CAD is trading in a bull trend above the 200-day simple moving averages (SMA).

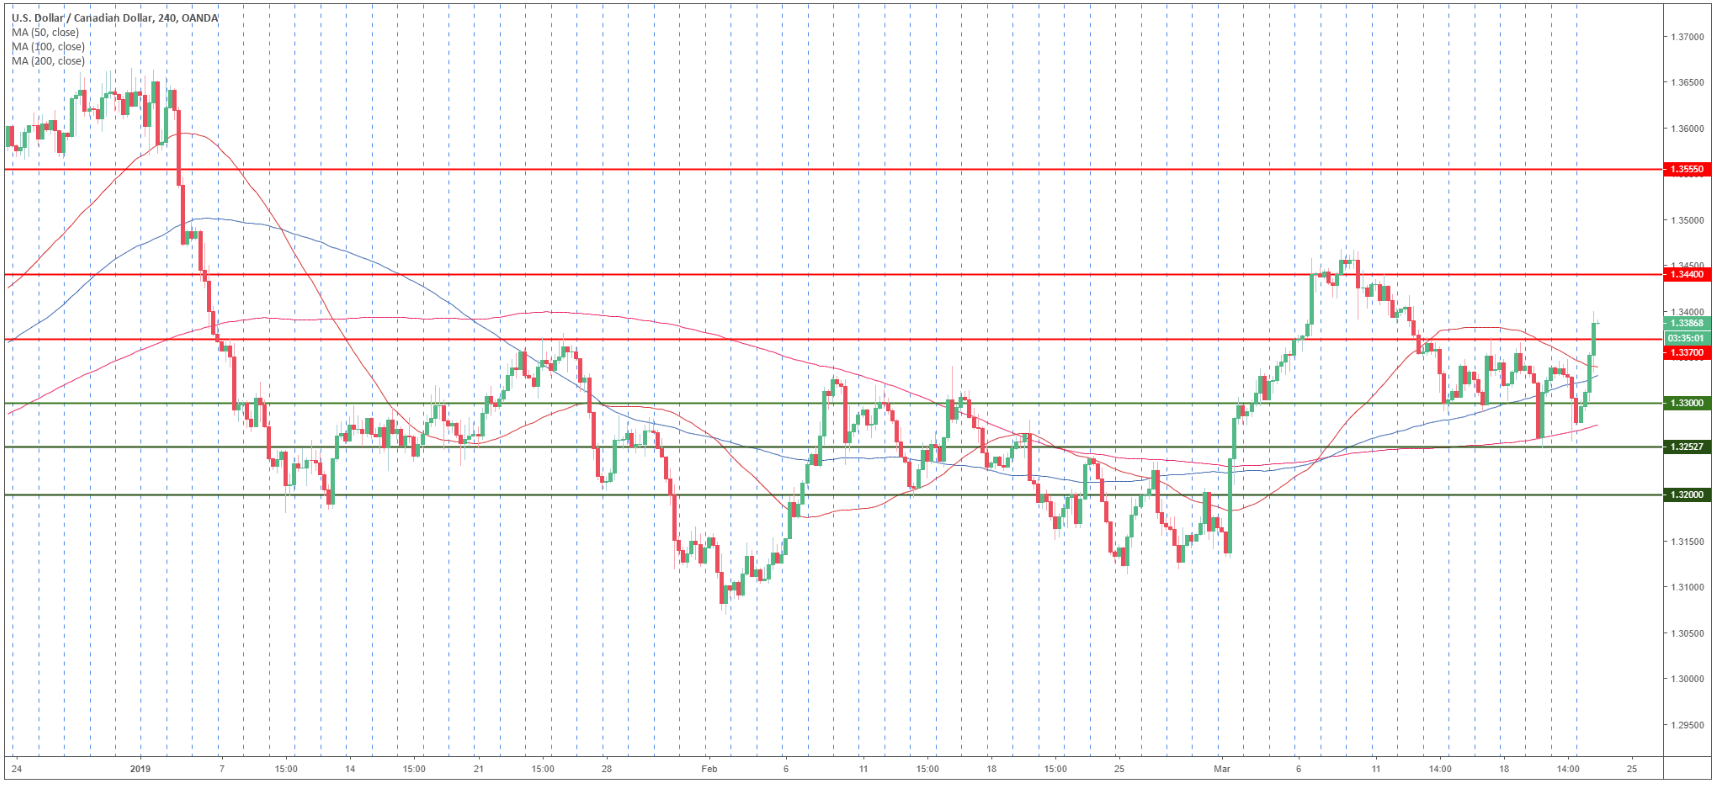
USD/CAD 4-hour chart
- USD/CAD is trading above its main SMAs suggesting bullish momentum in the medium-term.

USD/CAD 30-minute chart
- USD/CAD is trading above its main SMAs suggesting bullish momentum in the short-term.
- The break above 1.3370 can lead to 1.3440 resistance.
- Supports are at 1.3370 and 1.3300 figure.

Additional key levels
