GBP/USD Technical Analysis: Breakdown into 1.2500 signalling further declines
- The last twenty-four hours see the GBP/USD pairing testing the downside of the 1.2500 major handle, and intraday support rests at Tuesday's bottom of 1.2480 with intraday resistance priced in at the 38.2% Fibo retracement of 1.2540.
GBP/USD, 5-Minute
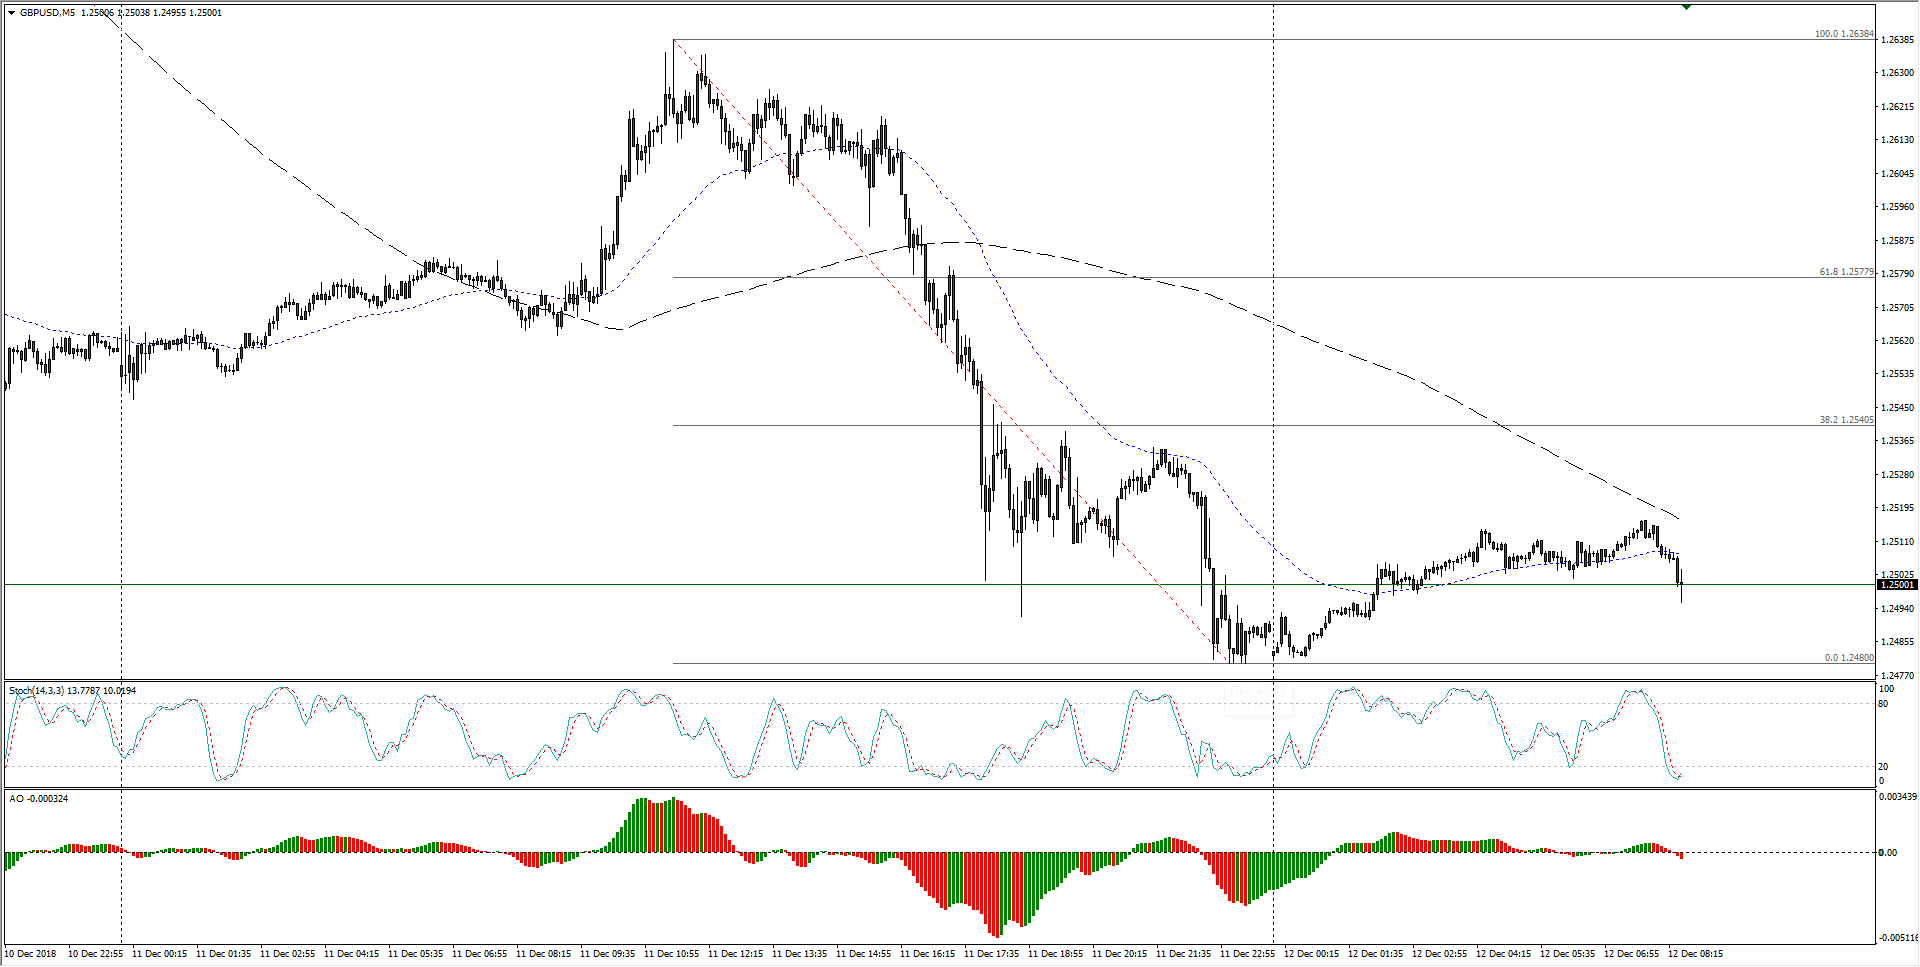
- The Cable has crossed a critical inflection point after pricing in a near-term lower high below the 1.2650 zone after the pair's floor collapsed, and now the pair is challenging into a new region.
GBP/USD, 30-Minute
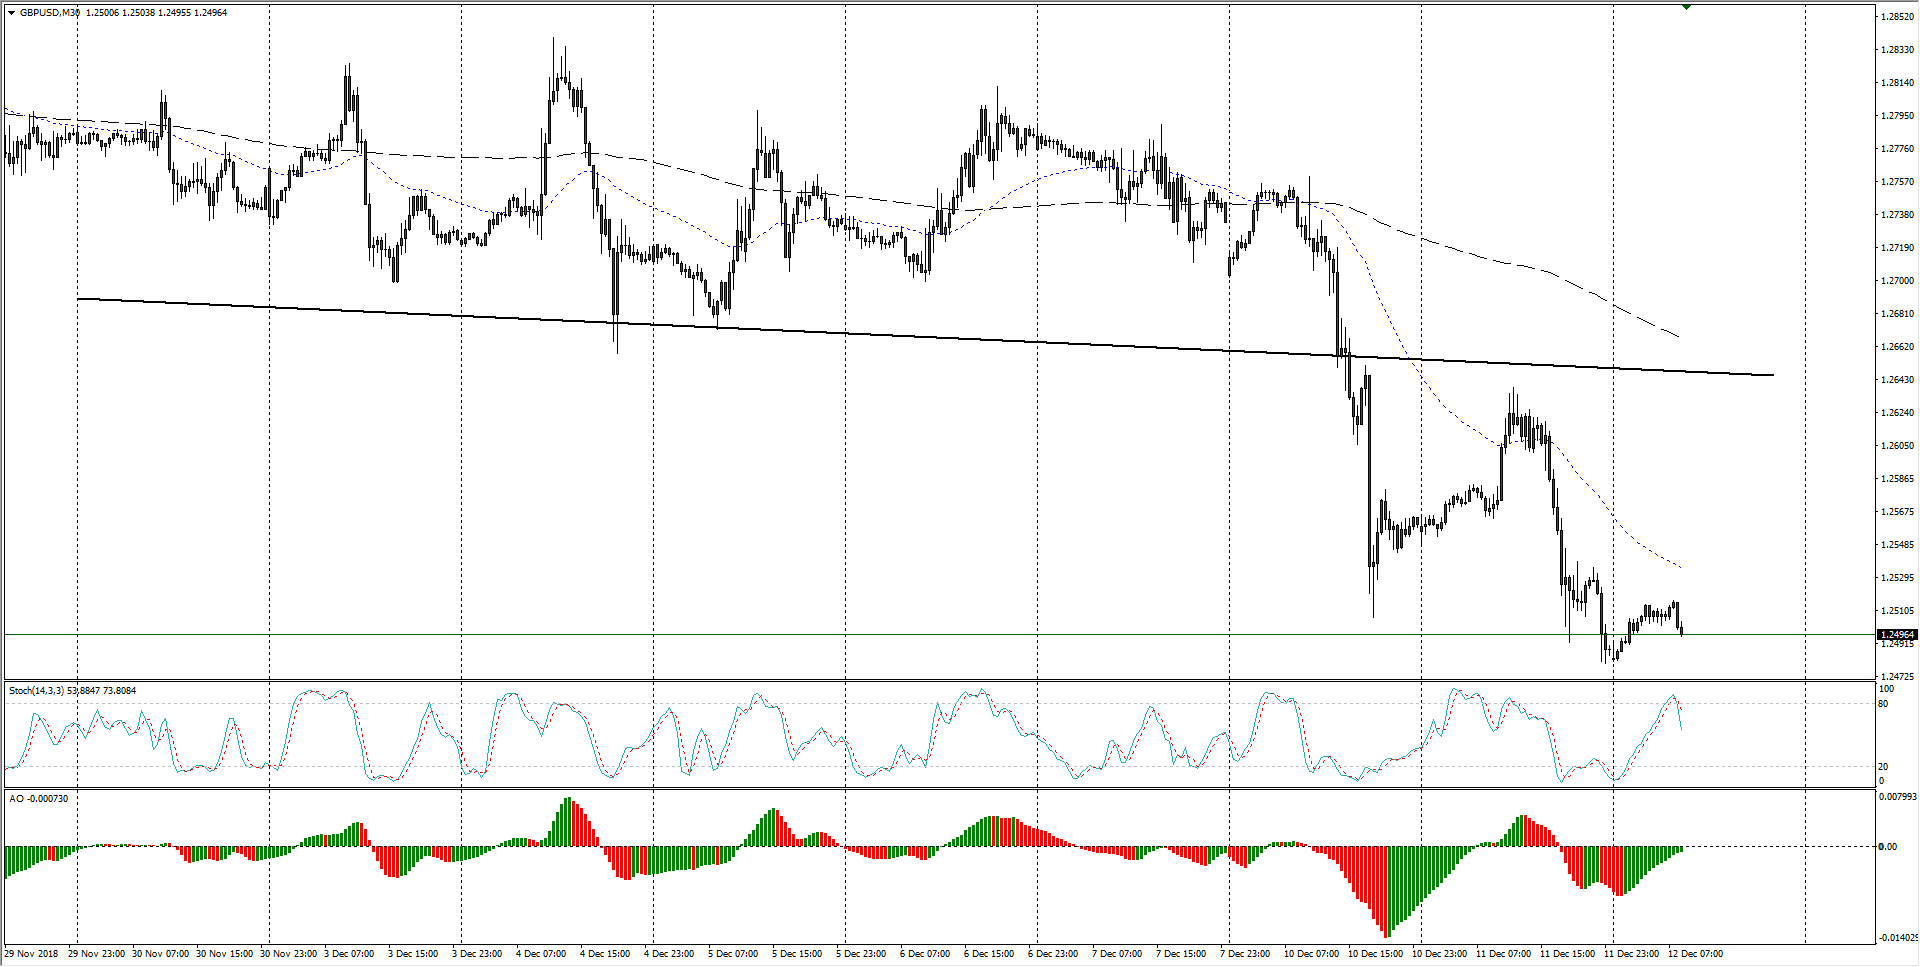
- Looking to the medium-term, linear regression suggests that the Cable could be due for a retracement to the midline, but with this key level also falling below the previous 1.2650 support level, a move back into the range is likely to see a reload on short positions for a break lower.
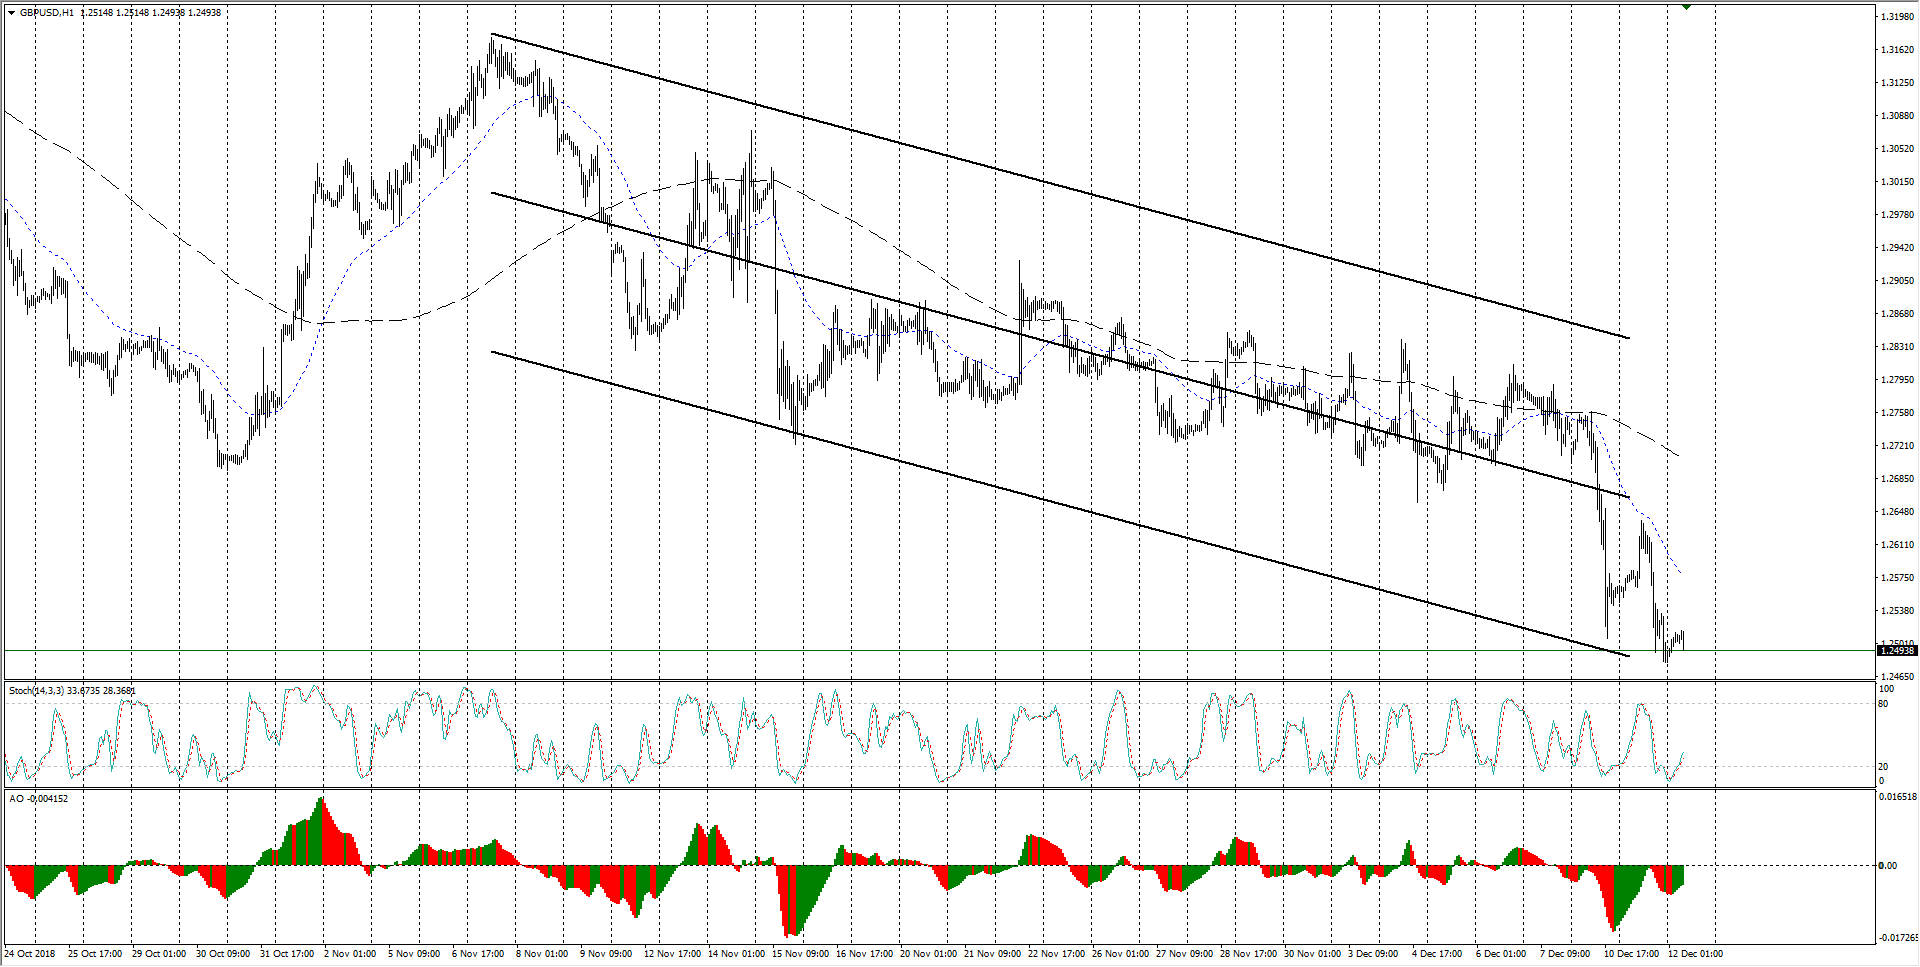
GBP/USD, 1-Hour
GBP/USD
Overview:
Today Last Price: 1.2509
Today Daily change: 12 pips
Today Daily change %: 0.0960%
Today Daily Open: 1.2497
Trends:
Previous Daily SMA20: 1.2769
Previous Daily SMA50: 1.2913
Previous Daily SMA100: 1.2946
Previous Daily SMA200: 1.3275
Levels:
Previous Daily High: 1.2639
Previous Daily Low: 1.2481
Previous Weekly High: 1.284
Previous Weekly Low: 1.2659
Previous Monthly High: 1.3176
Previous Monthly Low: 1.2723
Previous Daily Fibonacci 38.2%: 1.2542
Previous Daily Fibonacci 61.8%: 1.2579
Previous Daily Pivot Point S1: 1.2439
Previous Daily Pivot Point S2: 1.2381
Previous Daily Pivot Point S3: 1.2281
Previous Daily Pivot Point R1: 1.2598
Previous Daily Pivot Point R2: 1.2698
Previous Daily Pivot Point R3: 1.2756