Back
16 Nov 2018
AUD/USD Technical Analysis: Relentless bulls break above 0.7300 figure with 0.7400 target on the horizon
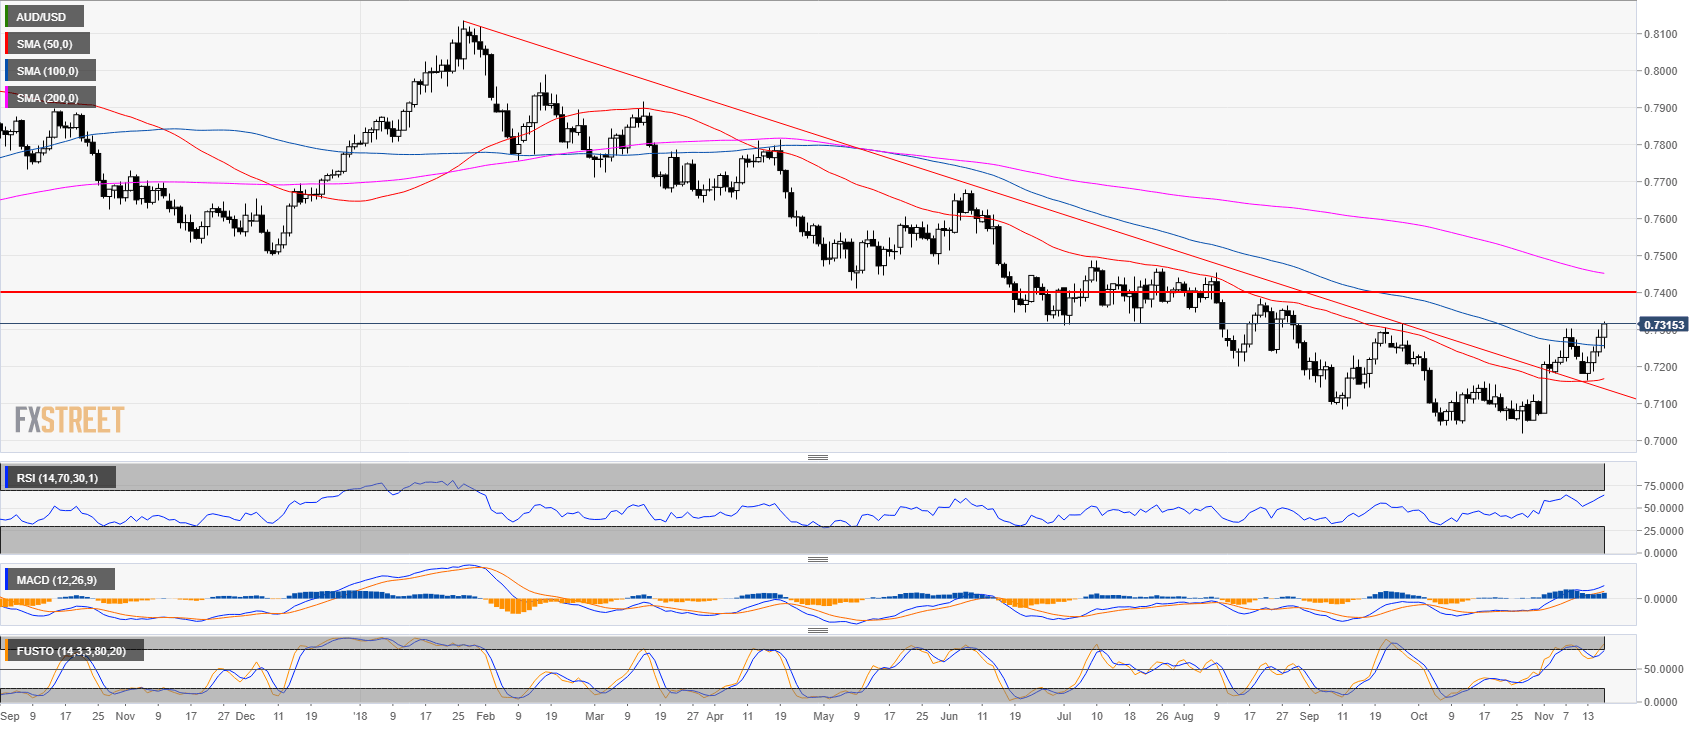
AUD/USD daily chart
- AUD/USD is above the 50 and 100-day simple moving average and the 2018 bear trendline.
- Technical indicators are positive suggesting continued bullish momentum.
- If bulls keep the momentum the next target is seen at 0.7400 figure. A close above 0.7300 figure on a daily closing basis would be seen as a sign of bullish strength.
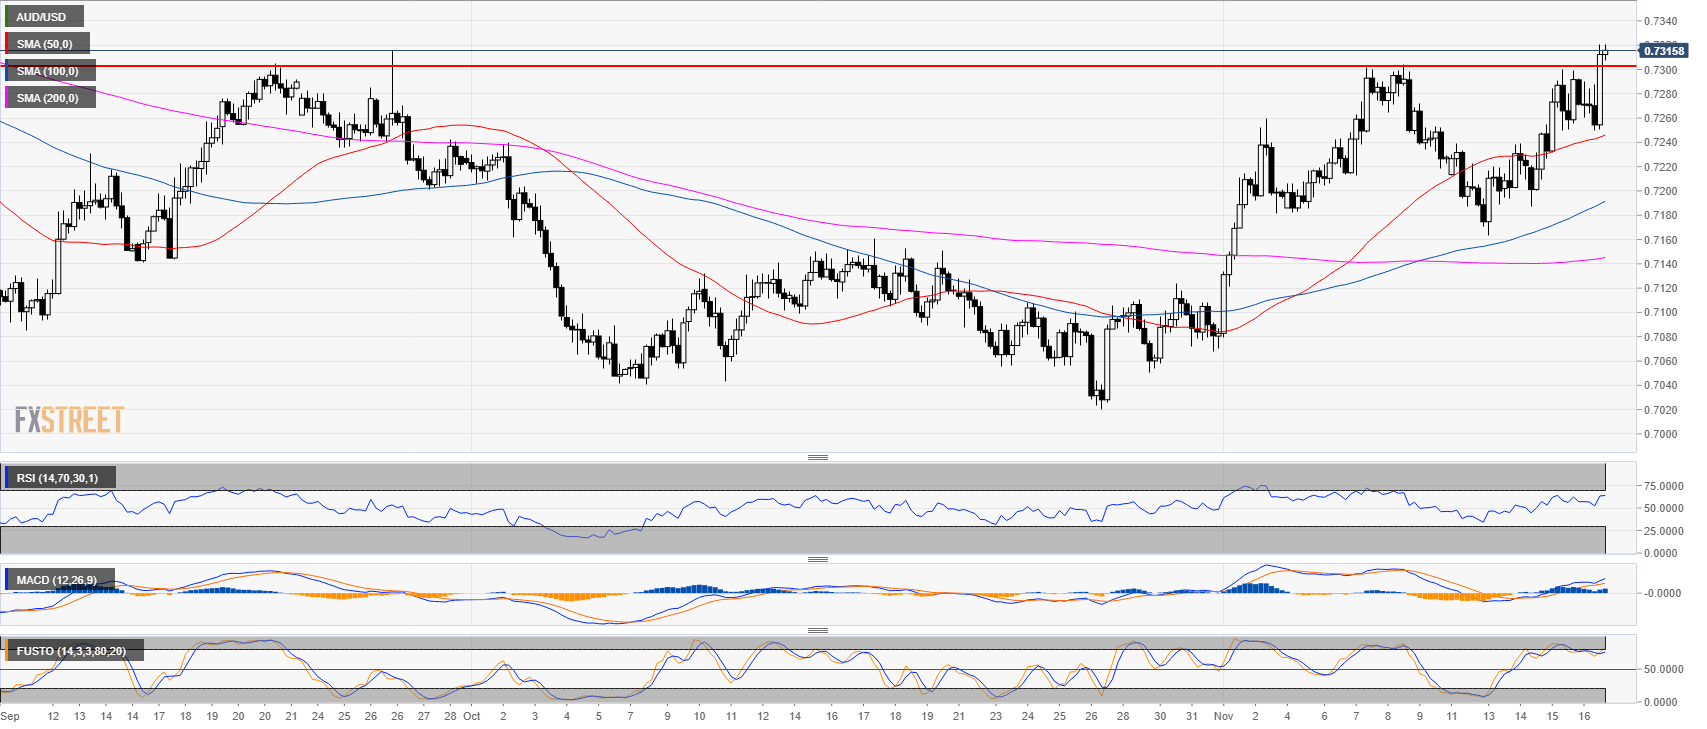
AUD/USD 4-hour chart
- AUD/USD is trading above the 50, 100 and 200-period simple moving averages (SMA) suggesting strong bullish momentum.
- Technical indicators are also at full bullish speed suggesting more up.
AUD/USD 30-minute chart
- AUD/USD bulls have printed a clean break above the 0.7300 figure.
- A break below 0.7250 would be a warning sign for bulls.
-636779851946872143.png)
Additional key levels at a glance:
AUD/USD
Overview:
Last Price: 0.731
Daily change: 31 pips
Daily change: 0.426%
Daily Open: 0.7279
Trends:
Daily SMA20: 0.7163
Daily SMA50: 0.7163
Daily SMA100: 0.7257
Daily SMA200: 0.7456
Levels:
Daily High: 0.73
Daily Low: 0.7226
Weekly High: 0.7304
Weekly Low: 0.7183
Monthly High: 0.724
Monthly Low: 0.702
Daily Fibonacci 38.2%: 0.7272
Daily Fibonacci 61.8%: 0.7255
Daily Pivot Point S1: 0.7237
Daily Pivot Point S2: 0.7195
Daily Pivot Point S3: 0.7164
Daily Pivot Point R1: 0.7311
Daily Pivot Point R2: 0.7342
Daily Pivot Point R3: 0.7384