Gold Technical Analysis: Pennant formation points to continuation of the bearish trend
• The commodity stalled its goodish recovery move from 19-month lows near 38.2% Fibonacci retracement level of the $1217-$1160 recent downfall.
• Subsequent price action between two converging trend-lines constituted towards the formation of a bearish continuation pattern - pennant, on the shorter time frame.
• Weakness below the pattern support, currently near $1173-72 area, coinciding with 23.6% Fibonacci retracement level, will signal resumption of the prior well-established bearish trend.
• Meanwhile, oversold conditions on daily & weekly charts could be only factors that might help limit any deeper downfall, at least for the time being.
Gold 30-min chart
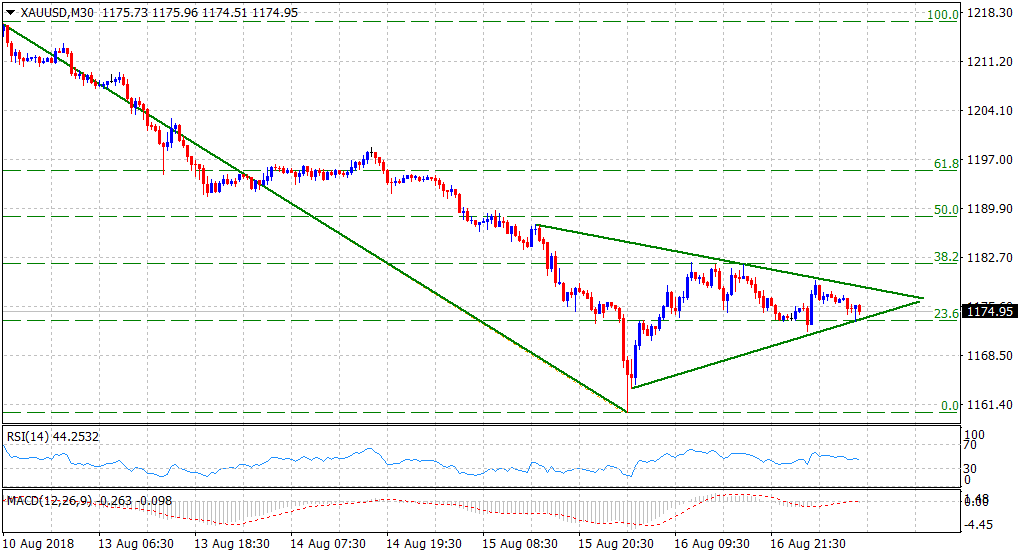
Spot Rate: $1175
Daily High: $1179
Trend: Bearish
Resistance
R1: $1179 (current day swing high)
R2: $1182 (38.2% Fibo. level)
R3: $1190 (horizontal zone)
Support
S1: $1172 (horizontal level)
S2: $1160 (multi-month low set yesterday)
S3: $1146 (2017 yearly low)