Gold Technical Analysis: Traders await a convincing break through near-term trading range
• The commodity remains confined within a broader trading range, held over the past week or so, and hangs near YTD lows set early this month.
• The near-term range play constitutes towards the formation of a rectangular chart pattern on the 1-hourly chart, indicating consolidation phase before the next leg of directional move.
• Short-term technical indicators on the daily chart are still holding in negative territory and thus, increase prospects for a bearish breakdown.
• However, it would be prudent to wait for a convincing breakthrough the trading range support, near the $1206 area, before positioning for any further near-term depreciating move.
Gold 1-hourly chart
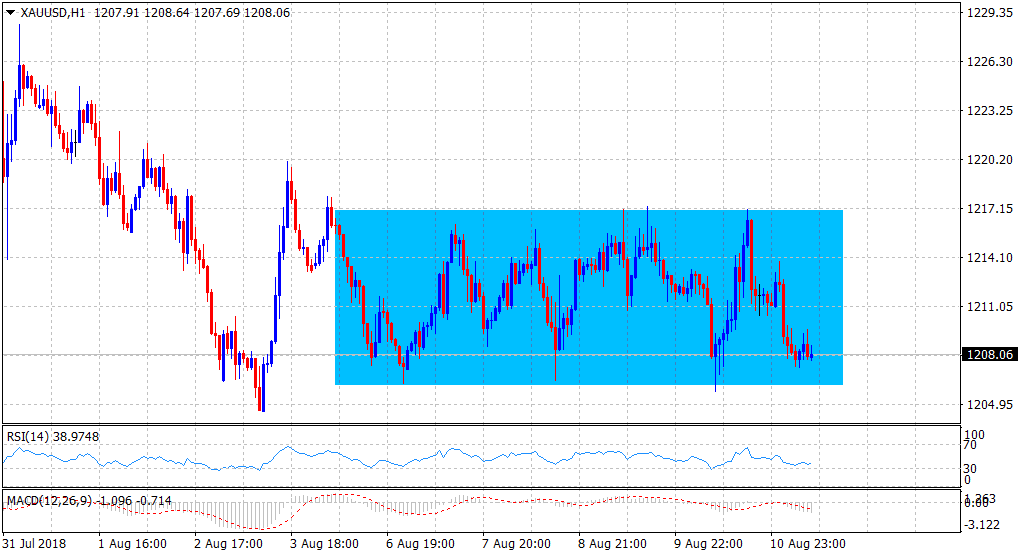
Spot Rate: $1208
Daily High: $1213.88
Daily Low: $1207.25
Trend: Bearish below $1206
Resistance
R1: $1214 (current day swing high)
R2: $1217 (one-week old trading range hurdle)
R3: $1228 (July 31 swing high)
Support
S1: $1205 (17-month low set on August 3)
S2: $1200 (psychological round figure mark)
S3: $1195 (March 2017 swing low)