USD/INR Price Analysis: Indian Rupee drops towards 82.50 support confluence
- USD/INR extends bounce off three-week-old support line towards short-term key resistance.
- 200-SMA, fortnight-long descending trend line challenges Indian Rupee bears.
- Steady RSI suggests further grinding of prices inside triangle formation.
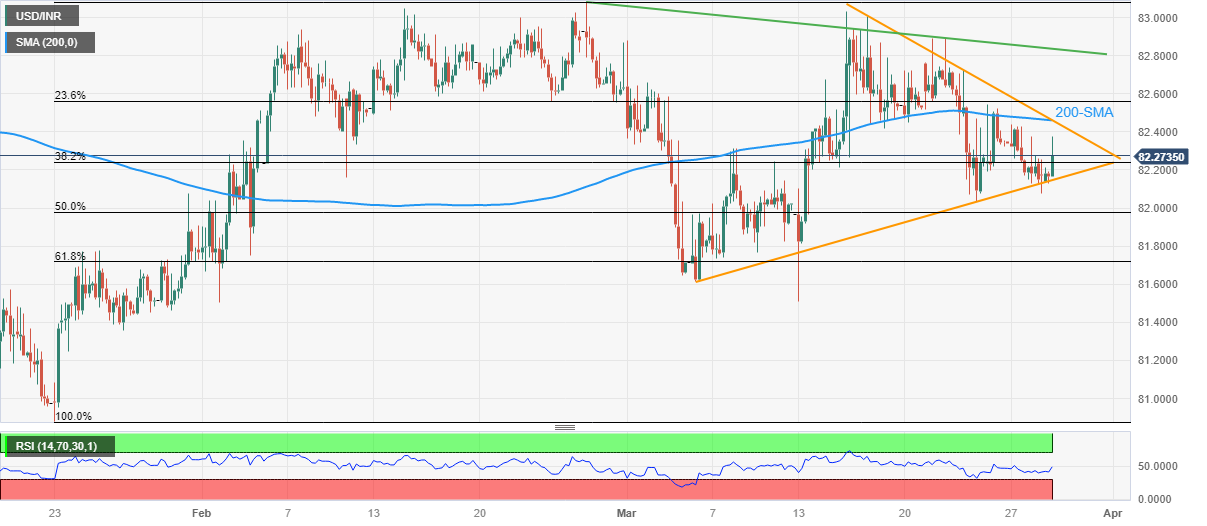
USD/INR picks up bids to pare weekly losses around 82.30 as it snaps a two-day downtrend amid early Wednesday. In doing so, the Indian Rupee pair rebounds from an ascending support line from March 06, and stays within the short-term symmetrical triangle.
It’s worth noting, however, that the steady RSI (14) line hints at the USD/INR pair’s further dribbling inside the stated triangle, currently between 82.15 and 82.50.
That said, the 200-SMA adds strength to the triangle’s top line surrounding 82.50, making it a tough nut to crack for the USD/INR bulls.
In a case where USD/INR price rallies beyond 82.50, a one-month-old descending resistance line near 82.85 can challenge the pair buyers before directing them to the multiple resistance area surrounding the 83.00 psychological magnet.
On the flip side, a clear break of the 82.15 level can quickly drag the USD/INR bears towards the 61.8% Fibonacci retracement level of the pair’s late January-February upside, near 81.70.
During the fall, the 82.00 round figure may act as an intermediate halt while the monthly low of near 81.50 acts as an extra filter towards the south.
Overall, USD/INR is likely to remain sidelined but the multiple hurdles toward the north keep the pair sellers hopeful.
USD/INR: Four-hour chart

Trend: Limited upside expected
