AUD/JPY Price Analysis: Bears are making their moves around Tokyo open
- AUD/JPY bulls are defending support on the daily chart but bears are stepping up again.
- A deeper correlation of the bullish recovery is eyed for the immediate future.
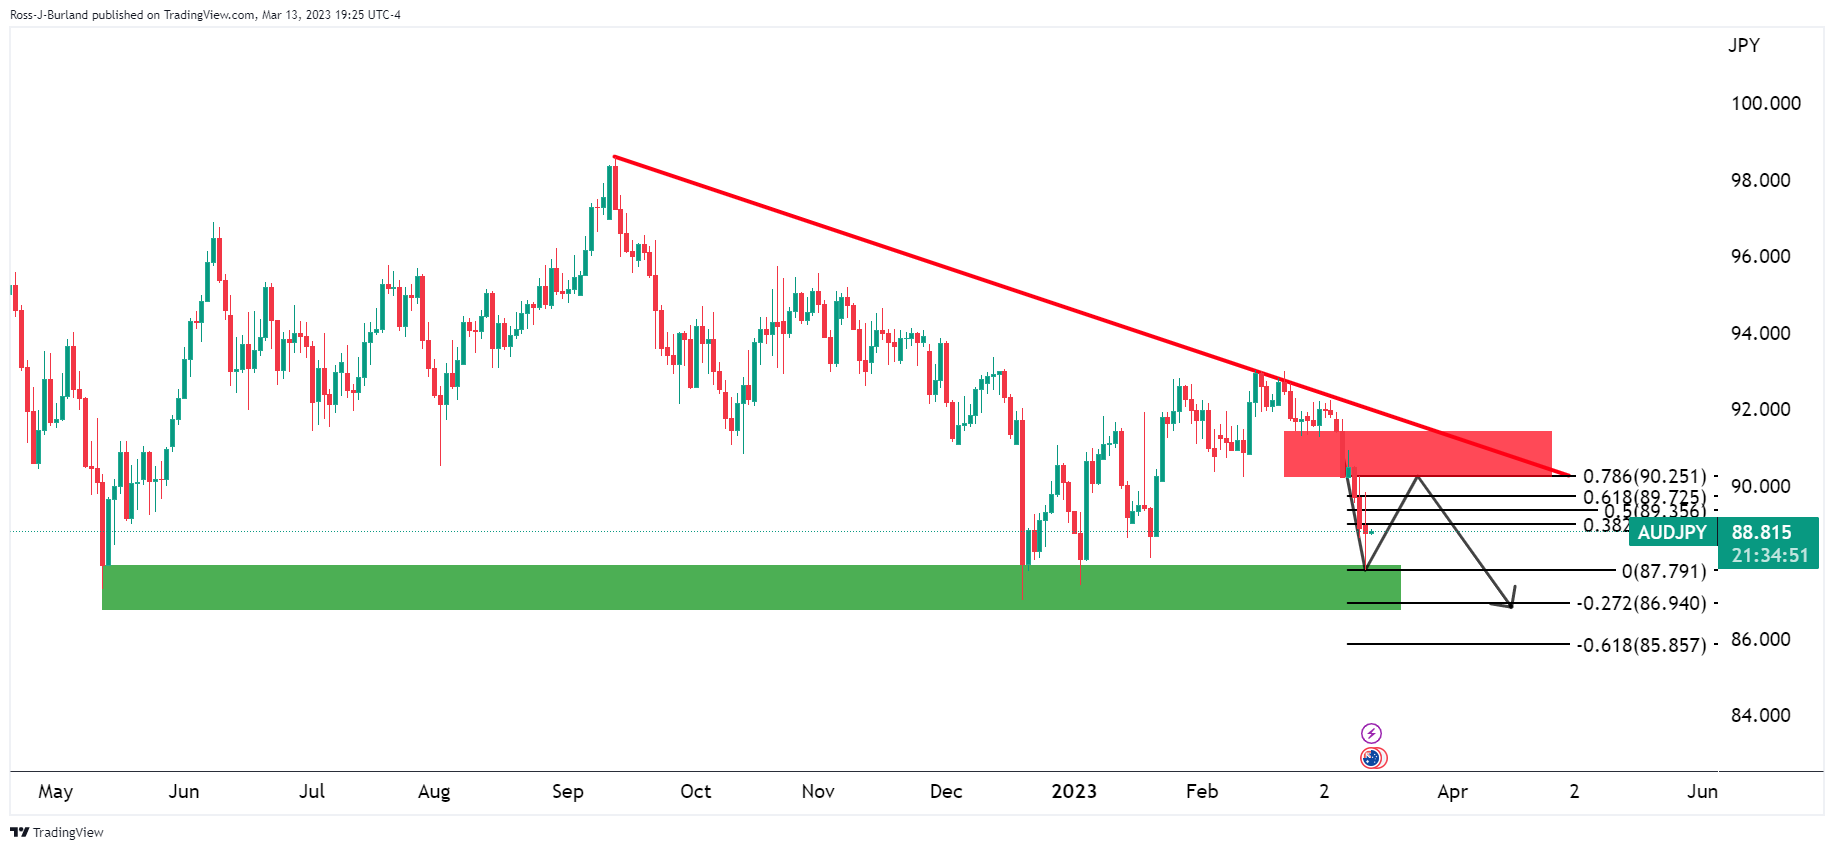
AUD/JPY is flat on the day so far approaching the Tokyo open, trading at 88.67 and sticking to a 20 pip range so far. The bulls are stepping in from daily support with prospects of a bullish correction towards prior support that would now be regarded as resistance. Pulling up the Fibonacci scale, there is an alignment with the 78.6% Fibonacci resistance near to 90.25:
AUD/JPY daily chart

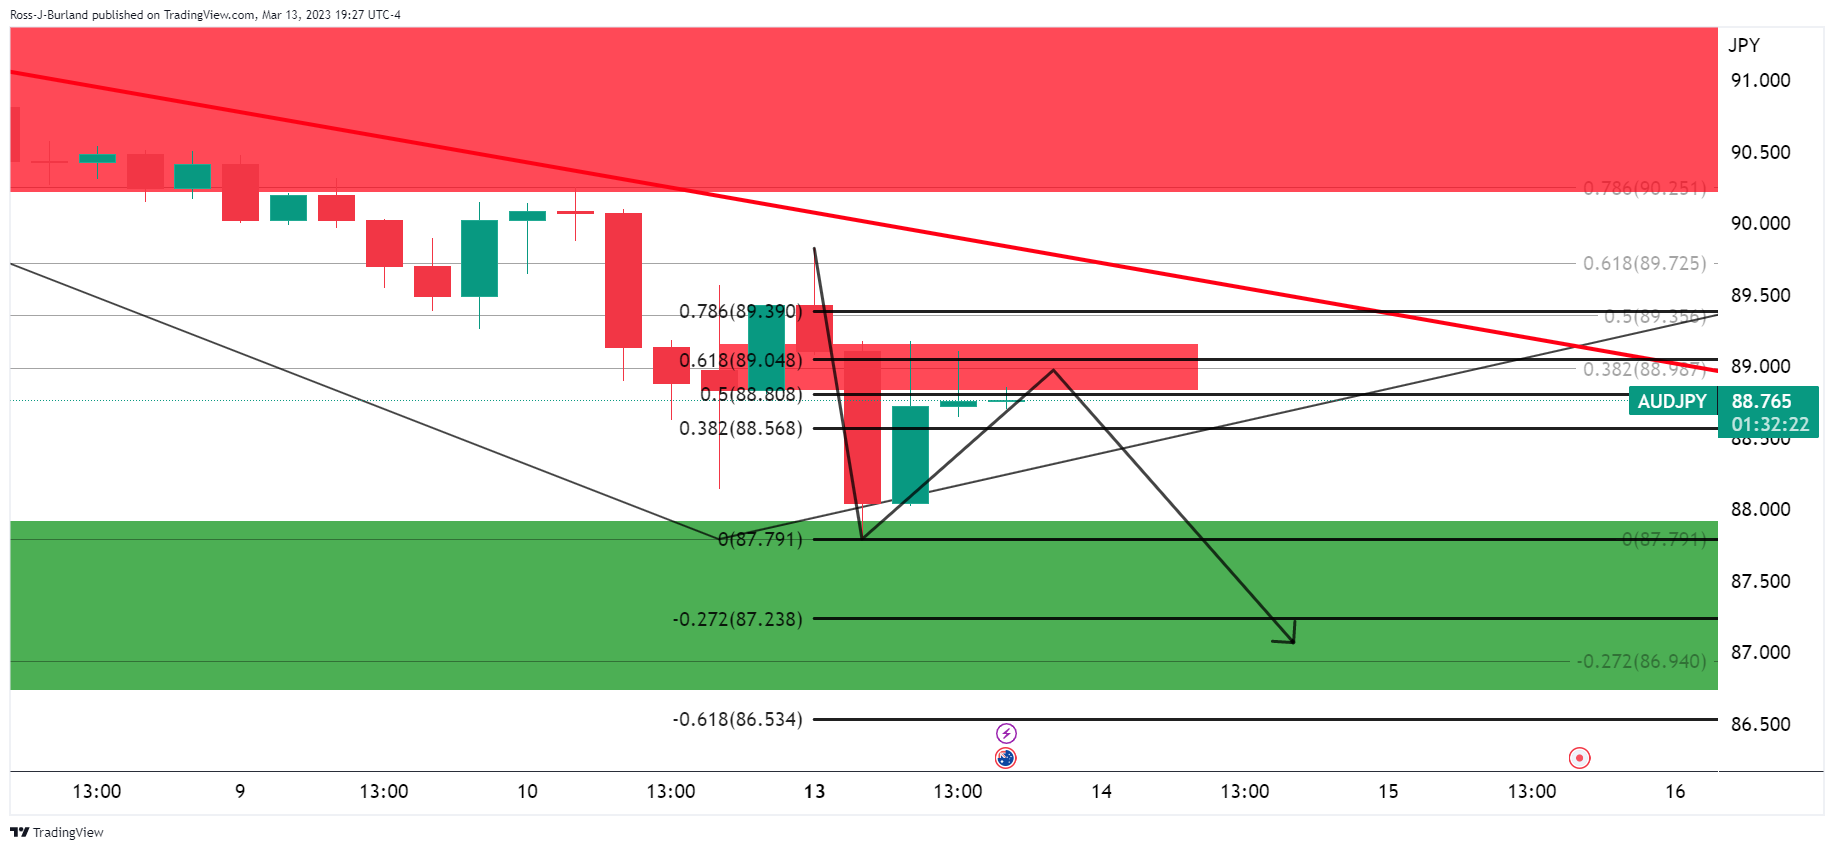
AUD/JPY H4 chart

However, moving down to the 4-hour time frame, we can see plenty of resistance near 89.00 and the fact that the price is stalling here, in a confluence with the 61.8% ratio, a downside case can be built, until a break of the resistance structure. We are still on the front side of the bear trend so a bullish thesis is not as easy to make.
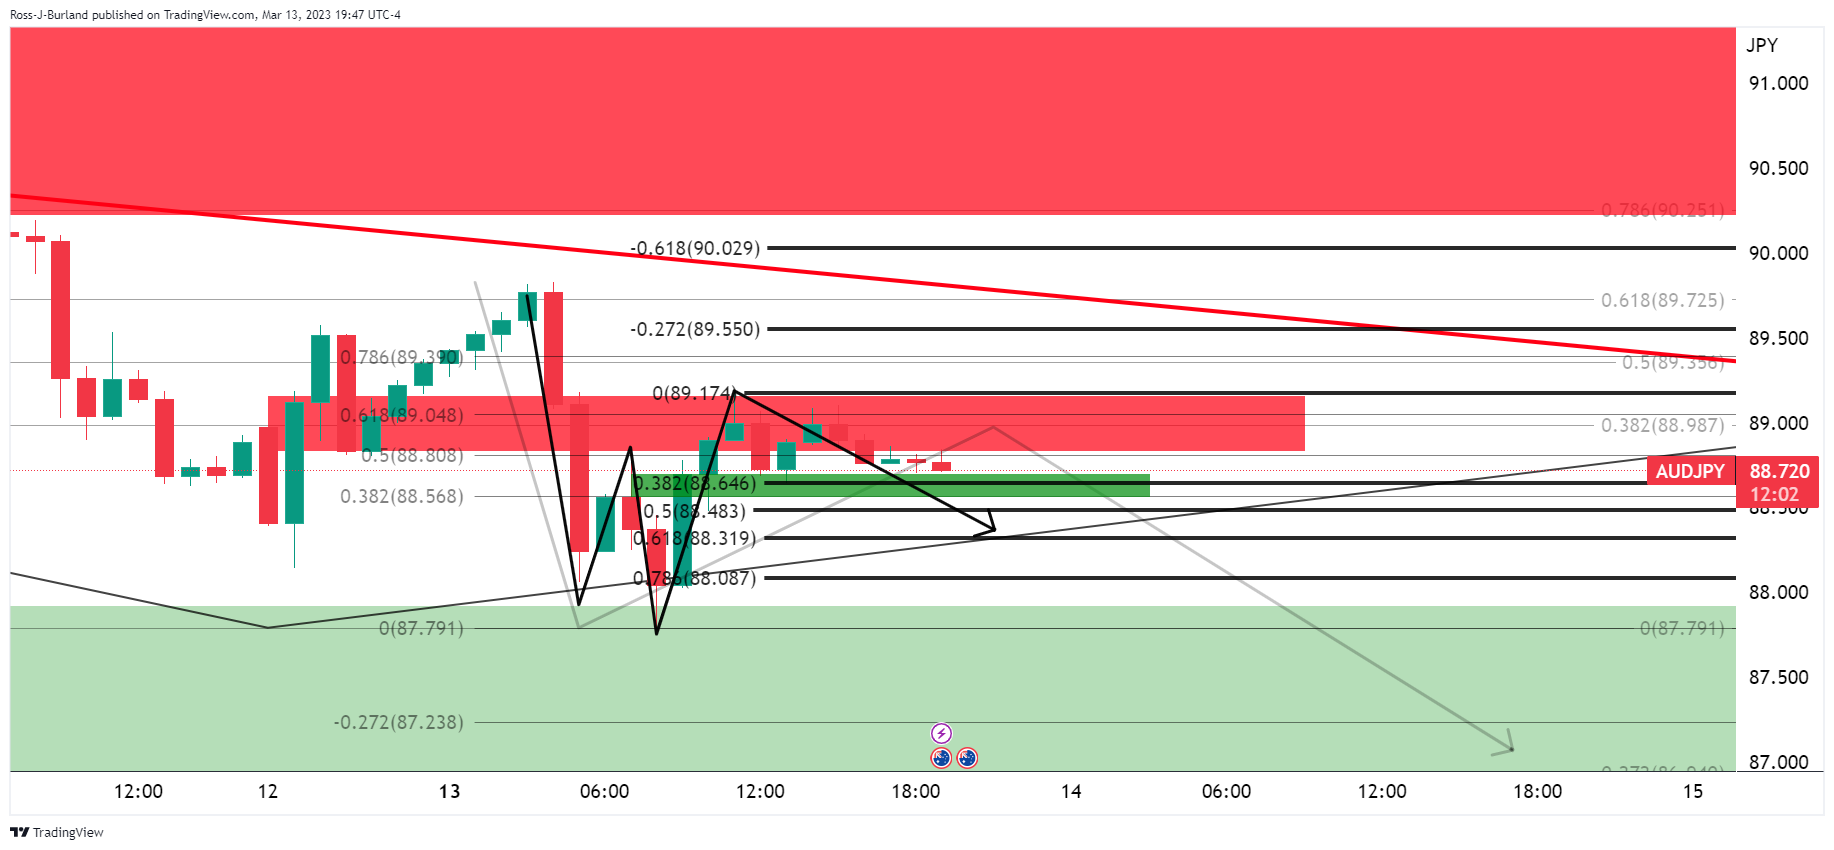
AUD/JPY H1 chart

The W-formation on the hourly chart sees the price drawn to the neckline and testing the 38.2% Fibonacci of the prior bullish impulse currently. A break here opens the risk of a deeper correction further into the Fibonacci scale where the 787.6% Fibo meets 88.00 the figure or thereabouts as the likely last line of defense before a bullish thesis can be made for the forthcoming sessions.
